Reports: DNI753243-DNI7: Identifying Molecular Structures of Polymers with Asymptotic Nonlinear Shear Rheology
Randy H. Ewoldt, PhD, University of Illinois at Urbana-Champaign
We specifically use the asymptotically-nonlinear large-amplitude oscillatory shear (LOAS)1 data which yields the two well-known linear material functions (G' and G") and four new nonlinear material functions. During the first year of the grant, we established that more modes are needed to fit nonlinearities as compared to linear data in contrast to the widely used approach of using the same number of modes for both linear and nonlinear data. Additionally, we observed that for a given number of modes, fitting all four nonlinearities together is the best strategy.
The second year largely focused on honestly quantifying the uncertaintyassociated with the fit parameters (eventually leading to quantitative uncertainty of inferred molecular features). We have observed that this requires fitting the linear and nonlinear data of asymptotic LAOS simultaneously in contrast to the established practice of fitting linear and nonlinear data separately. Currently, we are working toward validating various choices of “goodness of fit” measures and a better quantification of rheological data uncertainty (which is typically not available and an error model is assumed for it) as these are central to the calculation of model fit parameter uncertainties.
In addition, the PI collaborated with a colleague to develop a Bayesian inference technique for rheological model selection which has already resulted in a publication2. Currently, we are exploring the use of Bayesian framework for a better uncertainty quantification of the model fit parameters. One of the clear next step is to incorporate model inadequacy into the calculations.
Details on Progress
For a material under sinusoidal strain input signal, the time dependent stress response in the LOAS regime is 1:
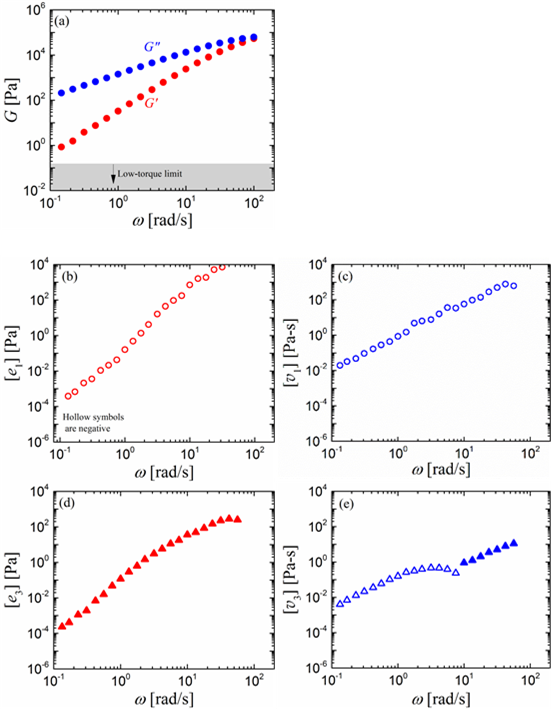
In addition to the two well-known linear viscoelastic moduli, we get four asymptotically-nonlinear material functions: [e1], [e3], [v1], [v3]. Figure 1 shows the results of measuring the two linear and four nonlinear signals for a 1,4-polyisoprene melt.
We consider fitting the linear and nonlinear measures using an n-mode Giesekus model3 where the fit parameters4 are the relaxation spectrum {Gi,
For Giesekus model, the linear material functions depend only on the relaxation spectrum while the nonlinear material functions depend on both relaxation spectrum and mobility factor. This presents two data fitting choices, (1): fitting linear data first and nonlinear data second, or (2): fitting linear and nonlinear data simultaneously. Two questions further arise: 1) which choice results in better fits and 2) which choice results in the most honest parameter uncertainty?
To answer the first question, we compare the normalized global residual sum of squares (RSS) at the least squares optimum point for the two schemes:
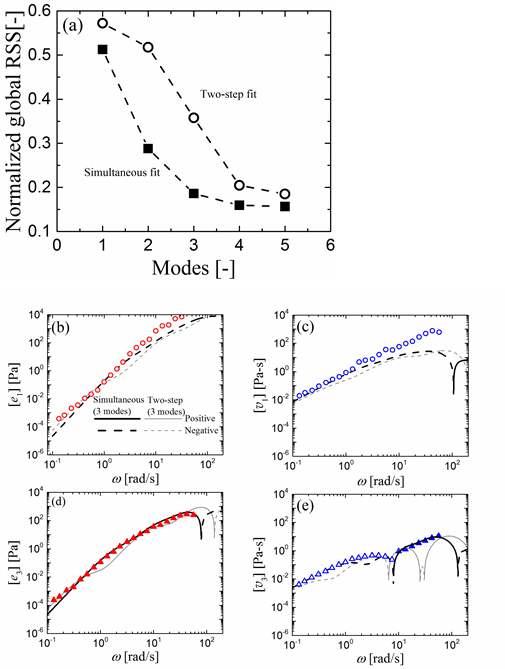
where Si is the ith signal and niis the number of corresponding observations. Figure 2 shows that simultaneous fitting provides better fits than the two-step fitting because of the availability of more fit parameters for the dominant nonlinear data.
The full uncertainty in a model parameter depends on the sensitivity of the model predictions to the parameter and its correlations with other parameters. It is related to the Hessian matrix (![]() ) and the optimum point
) and the optimum point ![]() as:
as:
 A partial uncertainty which ignores all parameter correlations (all off-diagonal elements of Hessian matrix being zero) comes out to be:
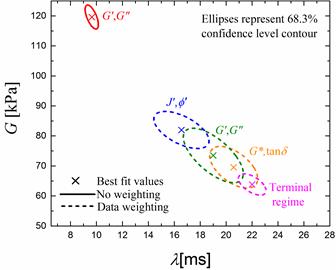
While fixing the linear parameters from step 1 in a two-step fit, we get a partial uncertainty in nonlinear parameters which is smaller than the full uncertainty obtained by simultaneous fitting. This is demonstrated for a linear data, single-mode fit in Figure 3. Additionally, different choices for LVE data representation in terms of, for example, compliances (J', J"), fluidities (ϕ', ϕ"), complex modulus and phase (G*, δ), terminal regime etc. and different goodness of fit measures (for example, different weighting in the RSS expression) result in scattered fit parameters and full uncertainty as shown in Figure 4. Thus, the actual uncertainty in LVE fit parameters spans a much larger domain than what is obtained by fitting one particular representation.
Impact
These results for honest full uncertainty quantification of model fit parameters are fundamental to inferring molecular features fromany combination of rheological measurements, be they linear, asymptotically-nonlinear, or fully nonlinear. As the next steps, we will consider incorporating model inadequacy, better quantification of the input data uncertainties and validating various goodness of fit measures.This funding has allowed the PI to support one graduate student and also supported time for himself to collaborate with a colleague. The student has thrived with this funding, having earlier presented this work as a poster at the 2014 Annual Meeting and a talk scheduled this year at 2015 Annual Meeting of The Society of Rheology (October 11-15, Baltimore, MD).
References:
1. Ewoldt & Bharadwaj, Rheol. Acta 2013
2. Freund & Ewoldt, J. Rheology 2015
3. (a) Giesekus, J. Non-Newtonian Fluid Mechanics 1982 (b) Giesekus, Rheol Acta 1982.
4. Bharadwaj & Ewoldt, J. Rheology 2015
Figures:
FIG. 1. Experimental measurements of the two linear and four asymptotically-nonlinear material functions on 1,4-polyisoprene melt.
FIG. 2. (a): Lower RSS (better fits) is observed for simultaneous fitting of linear (G', G") and non-linear ([e1], [e3], [v1], [v3]) signals compared to two-step fitting (linear first, then nonlinear). (b)- (e): Nonlinear data-fits under simultaneous and two-step fitting for three-mode Giesekus model.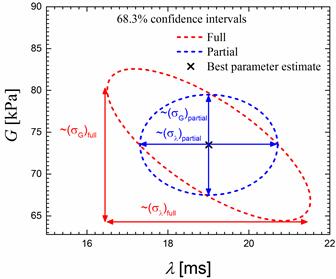
FIG. 3. Linear data, single-mode fit: Partial uncertainty obtained by ignoring parameter correlations is smaller than the full uncertainty. While full uncertainty is obtained by simultaneous fitting, partial uncertainty is obtained by fitting data in multiple steps, like the two-step fit.
FIG. 4. Linear data, single-mode fit: Different fit parameters and full parameter uncertainties are obtained depending on the goodness of fit measure (based on the weights used for residuals) and representation of LVE data used for fitting.


