Reports: DNI953763-DNI9: Impact of Organic-Matter Spatial Connectivity on Electrical Properties of Organic-Rich Source Rocks
 printer friendly
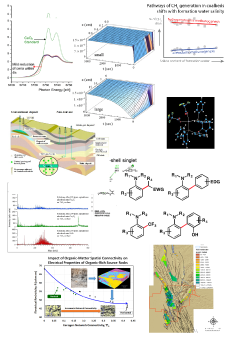
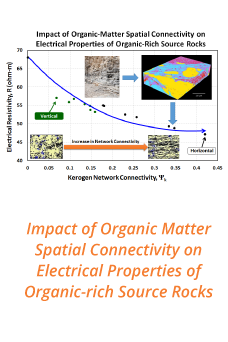
Production enhancement in organic-rich source rocks can be achieved by reliable reservoir characterization. However, conventional techniques for the characterization of organic-rich source rocks continue to leave many unanswered questions. Although borehole geophysical measurements can provide real-time formation evaluation, their interpretation in organic-rich source rocks remains challenging. Furthermore, hydrocarbon transport in tight organic-rich source rocks has not been understood well, spatial connectivity of organic matter within organic-rich source rocks is a parameter that significantly affects production from these reservoirs. The objective of this project is to quantify spatial connectivity of organic matter in organic-rich source rocks using borehole electrical resistivity measurements.
During the first year, the PI and her research team (a) developed a three-dimensional numerical simulator to calculate spatial distribution of electrical field potential and effective electrical resistivity in organic-rich source rocks, (b) introduced a directional connectivity factor to quantify directional connectivity of kerogen and other rock components, (c) quantified the impact of volumetric concentration, electrical resistivity, and directional connectivity of kerogen on electrical resistivity of synthetic rock samples, and (d) started laboratory experiments on quantifying electrical properties of kerogen.
OBJECTIVES
The objectives pursued during the first year included:
Objective No. 1: Quantify the sensitivity of electrical resistivity of organic-rich source rocks to spatial connectivity, resistivity, and concentration of kerogen
Objective No. 2: Quantify the impact of kerogen maturity and spatial distribution on electrical resistivity measurements
ACCOMPLISHED AND ONGOING TASKS: METHODS AND RESULTS
Task 1: Three-dimensional numerical simulations of electric potential field in organic-rich source rocks and assessment of effective electrical resistivity
To estimate pore-scale effective electrical resistivity, we solved the Laplace’s conductivity equation using finite volume method. The inputs to the numerical simulations include three-dimensional pore-scale images of the rock and electrical resistivity of all the components in the rock. The pore-scale rock images used as input files to the simulator include either synthetically developed volumes based on actual pore-scale images or actual pore-scale volumes obtained from FIB-SEM (Focused Ion Beam Scanning Electron Microscopy) imaging technique. Figure 1 shows a raw gray-scale and the corresponding segmented pore-scale images in an organic-rich source rock sample. The outputs include spatial distribution of electric field and equivalent electrical resistivity of the rock-kerogen-fluid system in different directions.
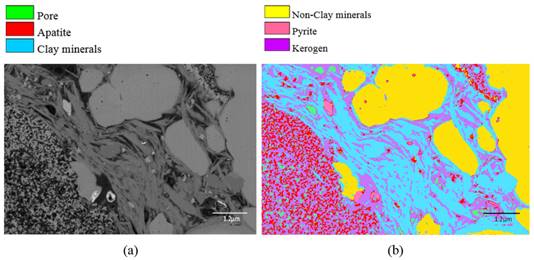
Figure 1: A 2D slice of the 3D SEM image in an organic-rich source rock sample (a) before and (b) after segmentation.
Task 2: Quantify the effect of resistivity and volumetric concentration of kerogen on electrical resistivity of rock
We quantified the influence of resistivity and volumetric concentration of kerogen on electrical resistivity of rock using three-dimensional (3D) numerical simulations of electric field potential. Figures 2a and 2b shows the effect of kerogen resistivity on the estimated effective resistivity of the source rock sample and the relative error in estimates of water saturation in the presence of conductive kerogen is not taken into account, respectively. This error can be up to 32% in this example. Numerical simulation results also showed that resistivity of the rock can drop by more than 15%, if volumetric concentration of kerogen varies from 5% to 25%. This drop in resistivity will be more significant, if connectivity of kerogen network increases.

Figure 2:Effect of kerogen resistivity on (a) the effective resistivity of the source rock sample and (b) the corresponding relative error in estimates of water saturation if kerogen conductivity is not taken into account.
Task 3: Define directional connectivity of kerogen network and quantify its effect on electrical resistivity of organic-rich source rocks
The directional connectivity along i direction (x, y, or z) is defined as

where M is the total number of the connected conductive clusters along i direction, Zj is the volumetric concentration of the jth connected conductive cluster, γ and β are connectivity parameters, and tj,i is the directional tortuosity of the jth connected cluster of each conductive component along i direction. tj,i is calculated using a random walk algorithm. Figure 3quantifies the impact of kerogen network connectivity on electrical resistivity of synthetic organic-rich source rocks in the (a) horizontal and (b) vertical directions. The results confirm that the increase in the directional connectivity causes a decrease in the electrical resistivity of the rock.
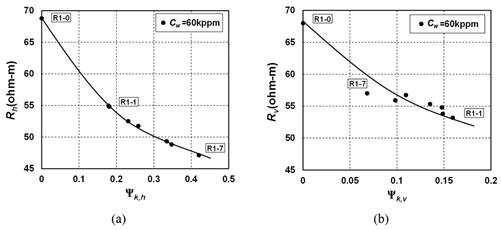
Figure 3: impact of kerogen network connectivity on electrical resistivity of synthetic organic-rich source rocks in the (a) horizontal and (b) vertical directions. Rh and Rvrepresent the electrical resistivity in horizontal and vertical directions, respectively.
Task 4: Quantify electrical properties of kerogen
This experimental ongoing task is required to obtain reliable input to the numerical simulations. The first step was to separate kerogen from organic-rich source rock samples using physical and chemical techniques. The isolated kerogen powder sample was then compressed to form a homogeneous consolidated disk. We synthetically matured isolated kerogen samples by heat-treating and measured electrical resistivity and geochemical properties of each set of molded samples at different maturity levels. The results demonstrated a significant decrease in electrical resistivity of isolated kerogen samples from the Haynesville (i.e., up to four orders of magnitude) and the Eagle Ford (i.e., up to nine orders of magnitude) formations upon increasing the heat-treatment temperature from 300°C to 800°C. The decrease of electrical resistivity at high maturity levels could be attributed to the presence graphite-like sheets and/or appearance of aromatic components in the organic matter, which will be further studied during the next year.
CONCLUSIONS
We introduced a method to calculate directional connectivity of kerogen in organic-rich source rocks using three-dimensional pore-scale rock volumes. We then quantified the impact of directional connectivity of mature kerogen network on the electrical resistivity of organic-rich source rocks using numerical simulations. The results of numerical simulations showed measurable sensitivity of electrical resistivity in different directions to the directional connectivity of the kerogen network, which can significantly influence interpretation of electrical resistivity measurements in organic-rich source rocks. It is also promising for quantifying directional connectivity of organic matter network using borehole geophysical measurements. Laboratory experiments also confirmed and quantified the decrease in resistivity of kerogen when its thermal maturity increases.