Reports: DNI554770-DNI5: Scanning Tunneling Microscopy Study of Subsurface Oxygen on Rh(111)
 printer friendly
Surface structures of Rh and Ag at high oxygen coverages
Scientific Progress
Support from the PRF has enabled advances in understanding the formation of subsurface oxygen (Osub) on Rh(111) and Ag(111), and structures on the oxidized surfaces under conditions of high oxygen coverages. On both Ag(111) and Rh(111), the surface becomes saturated with O, but additional oxygen atoms can absorb into the selvedge of the metal, resulting in total oxygen coverages in excess of a monolayer (ML). Additionally, we have studied how the flux and energy of incident gas-phase atomic oxygen (AO) influences the chemical state of the oxidized Ag(111) surface. These findings have provided needed guidance to further probe the chemical and physical properties of Osub.
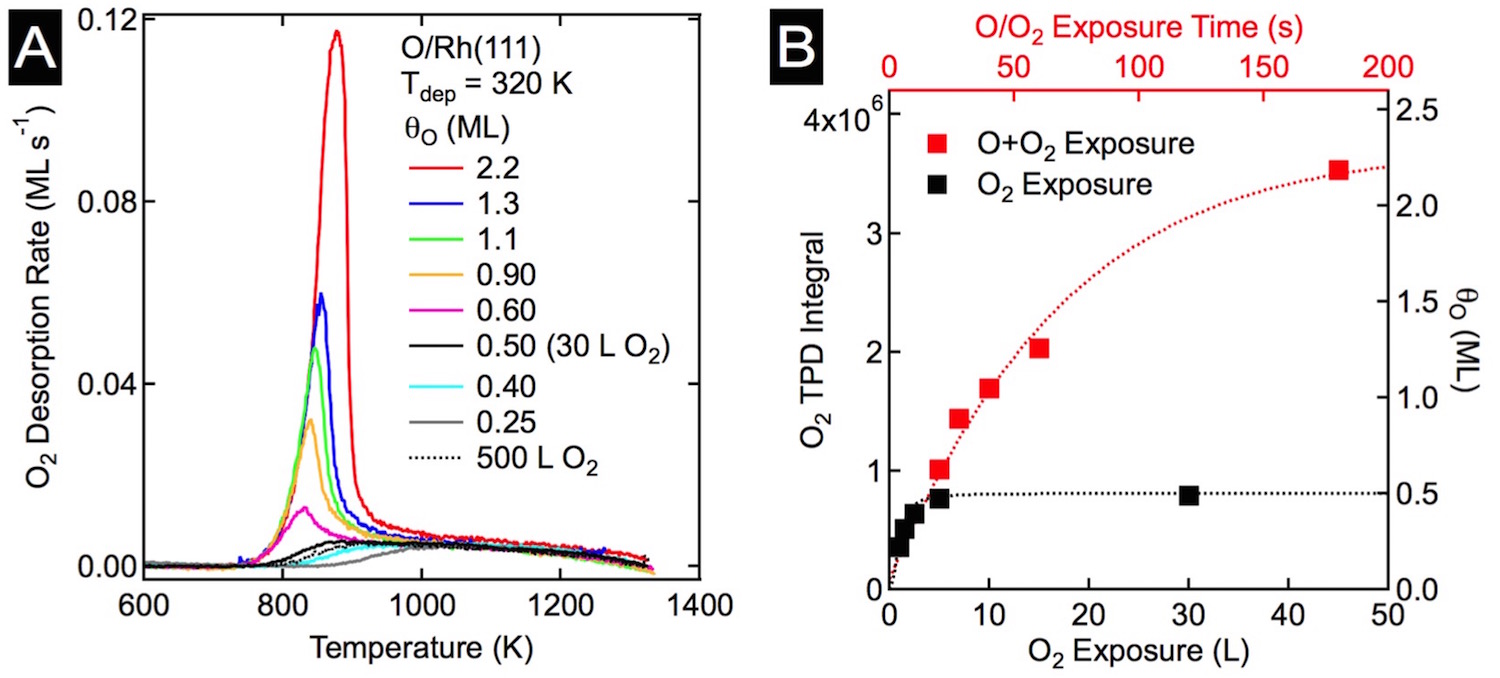
Figure 1: O uptake on Rh(111). A) TPD spectra after O2 and AO exposures. Coverages 0.5 ML an less (O2) show a broad desorption feature between 850 K and 1300 K. AO exposures resulted in O coverages in excess of 0.5 ML, and exhibited a sharp peak near 850 K. B) Plot of integrated O2 desorption and total O vs. oxygen exposure. The black squares are of O2 and the red are for AO.
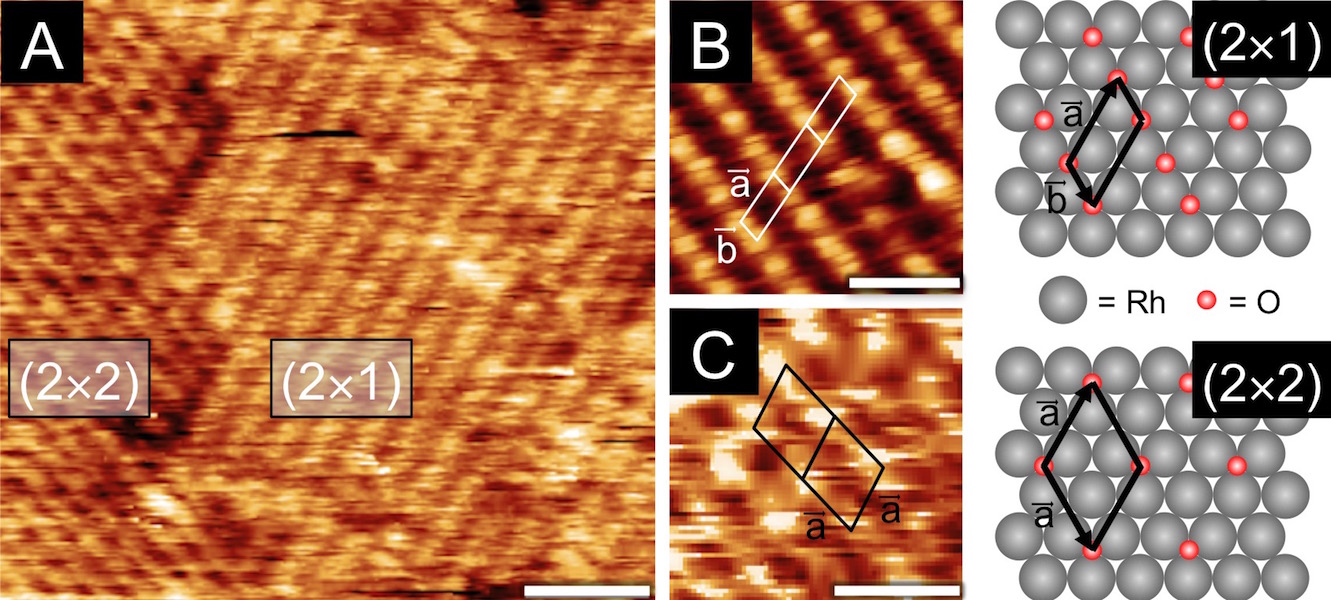
Figure 2: STM images of Rh(111) after oxygen exposures. A) qO = 1.1 ML showing low coverage (2«2)-O and (2«1)-O surface structures. B) qO = 0.6 ML detail of (2«1)-O structure and C) detail of (2«2)-O structure with qO = 1.1 ML.
For the rhodium study, a clean Rh(111) crystal was exposed to oxygen under ultra high vacuum (UHV) conditions; the oxygen coverage (qO) was measured using auger electron spectroscopy (AES), the total amount of oxygen quantified with temperature programmed desorption (TPD), and the surface structures were determined using low energy electron diffraction (LEED) and scanning tunneling microscopy (STM). O2 readily dissociates on Rh(111), and qO saturates at 0.5 ML, predominantly forming a (2«1)-O adlayer. However, small domains of the lower coverage, qO = 0.25 ML, (2«2)-O adlayers persist, even after long exposures, indicative of the asymptotic approach to 0.5 ML. Total oxygen coverages greater than 0.5 ML were achieved by dosing the Rh(111) sample with AO. As shown in Figure 1A, an 180 s exposure to AO resulted in a total O coverage of 2.2 ML. Interestingly, STM analysis (Figure 2) of the oxidized surface showed the same (2«1)-O adlayer as was found at qO = 0.5 ML; this suggested that the O in excess of 0.5 ML absorbs into the rhodium surface forming Osub.
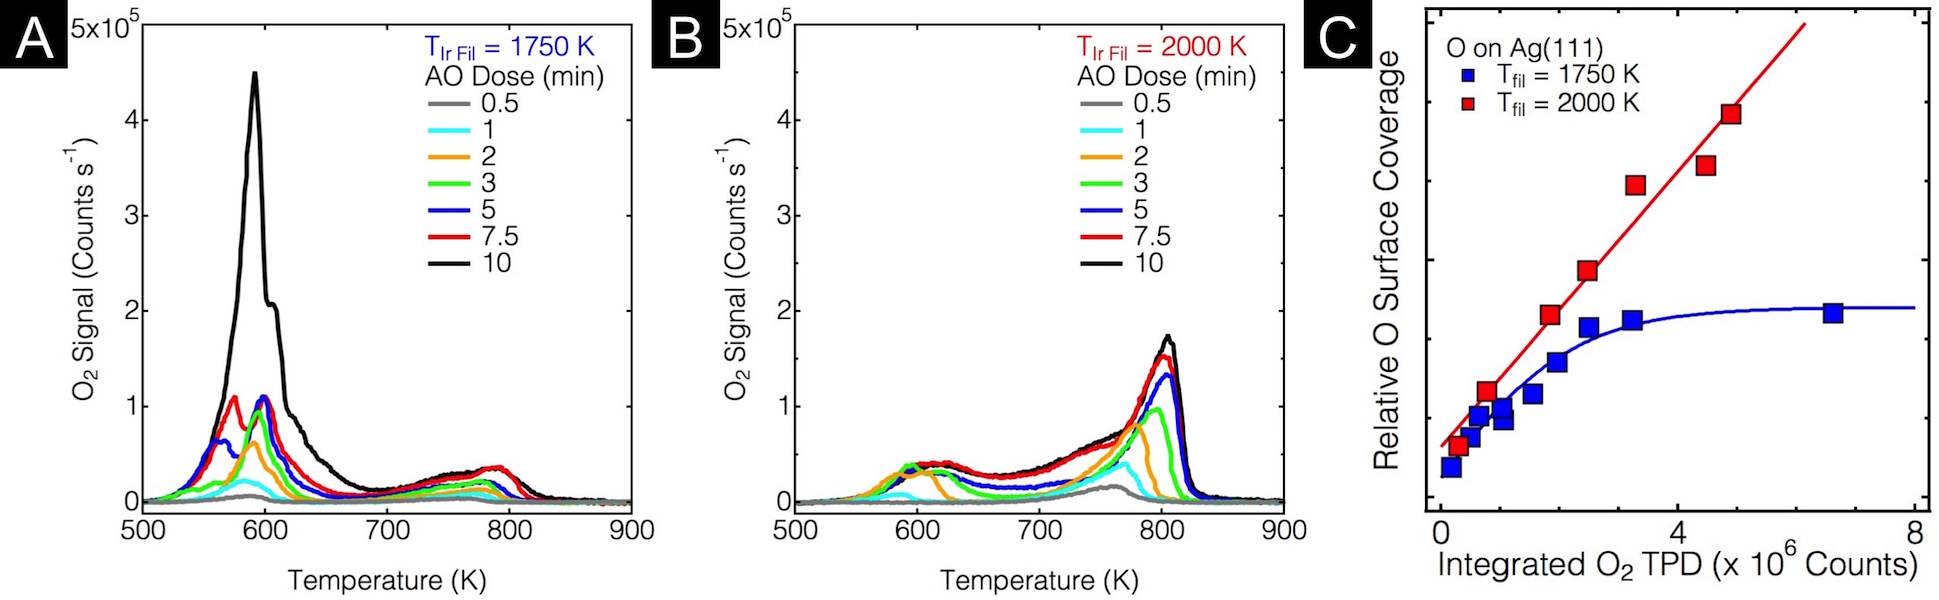
Figure 3: Quantification of O on Ag(111) after AO exposure. A) TPD with Tfil = 1750 K showing the primary desorption peak at 600 K. B) TPD for Tfil = 2000 K showing the shift of the desorption peak to 800 K and decreased intensity. C) Plot of Integrated TPD peak (total O) vs. Surface coverage; for Tfil = 2000 K, the relationship is linear, whereas for Tfil = 1750 K, the surface saturates and Osub is formed.
We have also studied a catalytically active surface, Ag(111), where extensive reconstruction occurs upon deposition of O atoms. We have focused on how subsurface O can be formed on Ag(111), and how the structure of the surface oxide may be perturbed when the selvedge is populated with O atoms. Ag(111) was exposed to gas-phase O atoms in UHV, and the resultant surfaces were studied with a combination of AES, TPD, LEED, and STM. Figure 3 shows TPD spectra for various exposures (Figure 3A and B) and a plot of the integrated TPD peak vs. the relative O surface coverage (Figure 3C). The temperature of the filament used to create atomic oxygen has a dramatic effect on the state of the oxidized surface. When Tfil = 1750 K, the expected surface oxides corresponding to the p(4«4)-O reconstruction were observed, as indicated by the TPD peak at 600 K and the structures observed with STM (Figure 4A). The divergence between the surface coverage and total oxygen suggests formation of subsurface oxygen after saturation of the surface. On the other hand, at 2000 K, thin films of the bulk oxide were formed, as indicated by the linear relationship between surface coverage and total O; additionally, the surface was difficult to image. After short exposures, patches of a moirŽ pattern of the Ag2O oxide were observed on the steps (Figure 4B), further supporting the formation of a thin film of the bulk oxide. Finally, Osub does not form under these conditions, because the O present was incorporated into the oxide thin film.
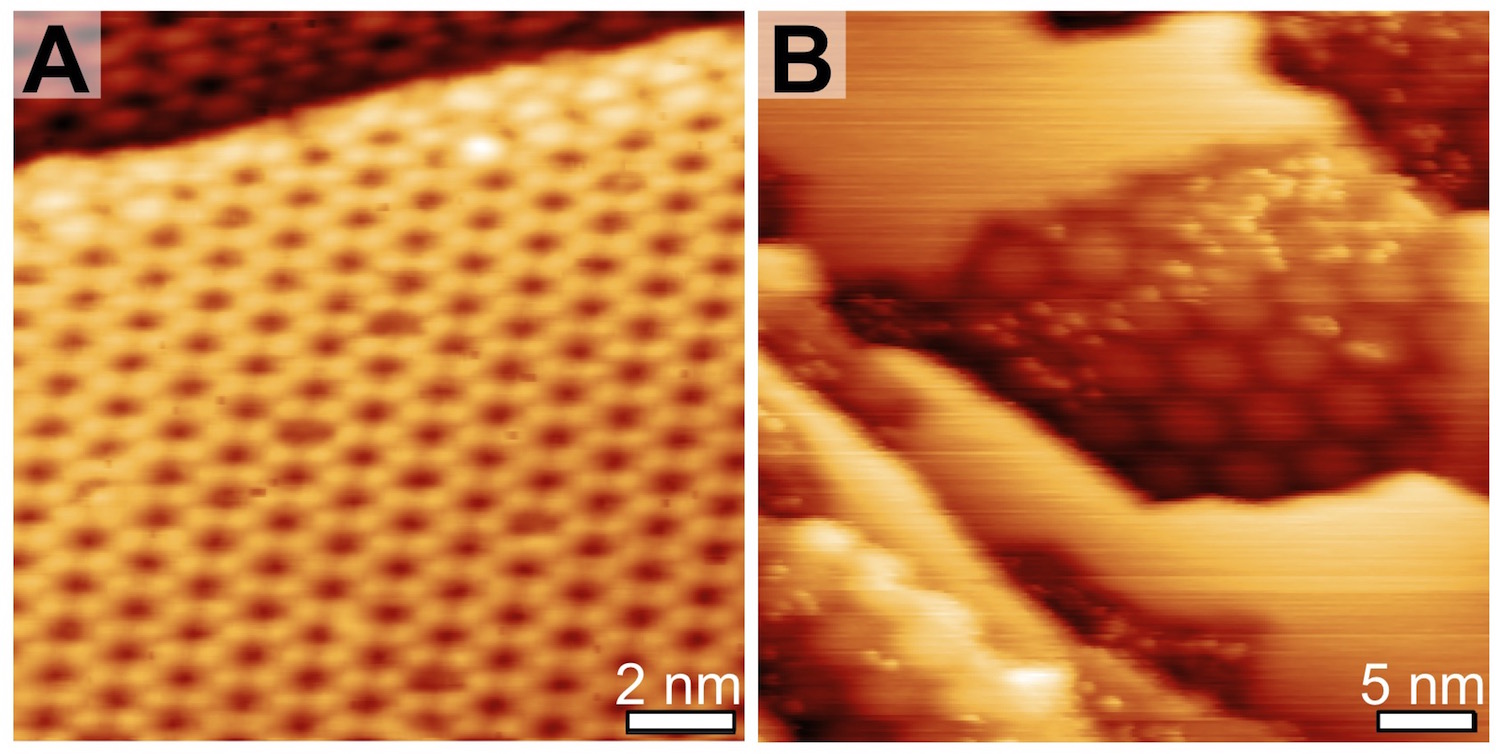
Figure 4: STM images of oxidized Ag(111) after A) 5 minute AO exposure with Tfil = 1750 K and B) 2 minute AO exposure with Tfil = 2000 K. The lower Tfil exposure yielded the p(4«4)-O reconstruction, with hexagonal structures less than 2 nm across, whereas the greater Tfil exposure resulted in a rougher surface with patches of moirŽ of Ag2O on Ag(111) around 7 nm across.
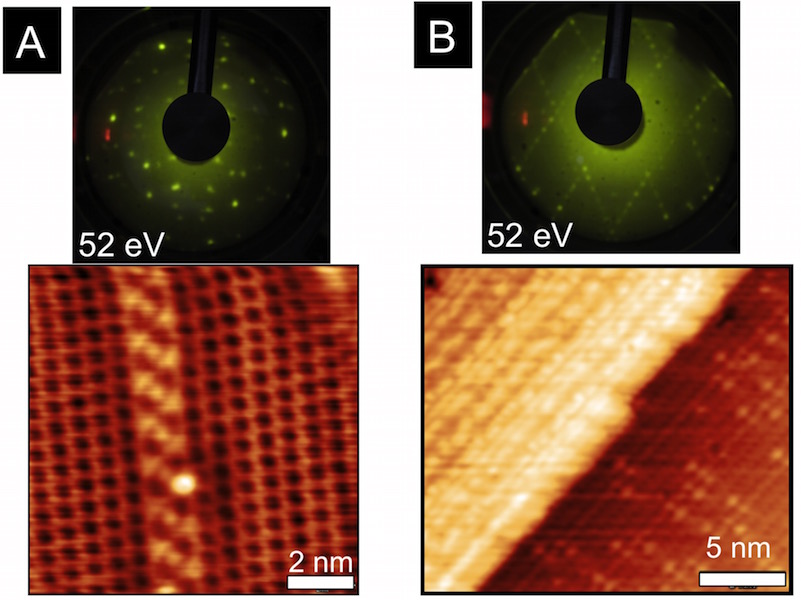
Figure 5: Structural analysis of Ag(111) oxidized at 490 K. A) 2 minute AO exposure, LEED (top) and STM (lower). STM conditions, 400 mV, 260 pA. B) 5 minute AO exposure, LEED (top) and STM (lower). STM conditions, 800 mV, 200 pA.
Additionally, the surface structures under several qO were determined with LEED and STM. When the Ag(111) crystal was exposed to AO (Tfil = 1750 K) with a surface temperature of 490 K, Osub was readily formed after a 5 minute AO exposure, but only the surface oxide was observed after 2 minutes. The STM images showed that at 490 K, the surface becomes coated with a c(4«8)-O adlayer, but with several coexisting domains, as indicated by the distorted LEED pattern (Figure 5A). With increasing exposure, the LEED showed a sharp, yet dim, pattern, and STM images show a striped pattern. The details of these patterns are still being analyzed, but it is clear that the incorporation of Osub has a rather disruptive effect on the structure of the surface oxide, in stark contrast to the insensitivity of Rh(111) O adlayers to the presence of Osub.