Reports: ND954562-ND9: Nanometer-Scale Gas Transport in Shale Reservoirs
 printer friendly
In this project, we are developing simple engineering tools and models capable to calculate mass transport through unconventional tight porous shale reservoirs. In order to resolve fluid dynamics in nano-scale confinements, we employed Molecular Dynamics (MD) method. Using our existing MD algorithm, we (1) properly calculated molecular mean free paths (MFP) inside nano-conduits, (2) devised simple correction model for existing Kinetic theory (KT) calculations for nano-scale flows, and (3) further developed Smart Wall MD (SWMD) algorithm in order to model cylindrical systems with specific material structures in the first year of the project.
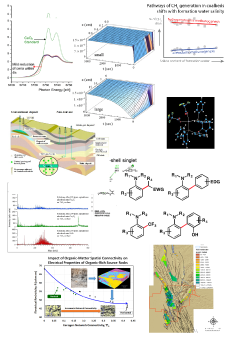
(1) Gas states evolve through intermolecular collisions separated by ballistic motion of molecules characterized by the molecular free paths. The average of these, known as MFP, is a key parameter in gas dynamics. Non-equilibrium behavior in rarefied and nano-scale gas flows is determined as a function of the Knudsen number (k), which is the ratio of gas MFP and the characteristic flow dimension. Hence, accurate prediction of k relies on correct calculation of MFP. Recent literature presents variations in MFP as a function of the surface confinement, which is in disagreement with KT and leads to wrong physical interpretations. This controversy occurs due to erroneous definition and calculation practices. For such cases, we utilized MD to calculate gas MFP for force-driven gas flows confined in nano-channels. Studies performed in the transition flow regime in various size nano-channels and a range of gas–surface interaction strengths (εwf/εff) have shown isotropic mean travelled distance and MFP values in agreement with KT regardless of the surface forces and surface adsorption effects (Figure1). Comparison of the velocity profiles obtained in MD with the linearized Boltzmann solutions at predicted k shows good agreement in the bulk of the channels, while deviations in the near wall region due to the influence of surface are observed.
Our simulations employed molecular surfaces with atomistic corrugations and surface forces different than the earlier studies using Maxwell type planar boundary conditions. Even in such a case, carefully conducted MD simulations validate the KT definition of MFP in nano-scale confinements as small as 10 nm (Figure2a). In fact, MFP calculations should solely rely on gas–gas collisions outside the adsorbed gas regions and should be performed for a time frame that is several mean-collision-times long. Since MFP is a discrete length scale, it should not be measured every time step and for length scales smaller than itself. This methodology and our MFP results are validated by the velocity profiles for force-driven nano-channel flows, which agree well with the kinetic theory predictions in the bulk flow region (Figure2b). Impact of this research includes (i) reporting the proper molecular MFP calculations and k based characterization of gas velocity profiles in nanoscale confinements with realistic molecular surfaces, and (ii) validation of theoretical KT based MFP calculation model to apply on nano-confinements. This research was published in Microfluidics Nanofluidics, 2015,18(5-6):1365-1371.
(2) Molecular dynamics simulations of force-driven nano-channel gas flows show two distinct flow regions. While the bulk flow region can be determined using kinetic theory (Figure 3), transport in the near-wall region is dominated by gas-wall interactions. This duality enables definition of an inner-layer scaling, y*, based on the molecular dimensions. For gas-wall interactions determined by Lennard-Jones potential, the near wall velocity distribution exhibits a universal behavior as a function of the local k and gas-wall interaction parameters, which can be interpreted as the “law of the nano-wall” (Figure 4). The velocity profile matches KT solutions in the bulk. Knowing the velocity and density distributions within this region and using the bulk flow velocity profiles from Beskok-Karniadakis Model (BKM), we outline a procedure that can correct kinetic theory based mass-flow rate predictions in the literature for various nano-channel gas flows (Figure 5). This work, essential in correction of kinetic theory based models for nano-scale gas flows, is submitted to “Microfluidics Nanofluidics” in September 2015.
(3) Tasks (1-2) were conducted by developing force-driven MD in Cartesian coordinate system. Our main objective is to further perform similar studies in the cylindrical coordinate system to develop phenomenological corrections for gas transport in nano-porous media. Also most geologically relevant porous structures are tubular in shape. We performed code development on the existing SWMD, and successfully achieved its implementation in cylindrical coordinates. The Smart Tube MD (STMD) can simulate various forms of tubular nano- structures (Figure6). Currently we are implementing diatomic Nitrogen modeling in the STMD code.
This grant enabled fundamental understanding of gas transport in nano-porous media. We already discovered “the law of the nano-wall,” and developed a correction to modify KT based data for nano-flows. These advances will lead to many scientific and technological advances and will enable further research opportunities for the PI and his staff, especially in gas-petroleum research arena.
Figure 1. Gas velocity distribution (u) at 298K confined in nano-channels calculated by MD and predicted by Maxwell–Boltzmann distribution (Theory) (a). Distribution of normalized gas free paths (l/λ) measured by MD and predicted by KT (b).
Figure 2. Velocity profiles for k=1 flows (a) in 10.8nm, 27nm, and 54nm height (H) channels with εwf/εff= 1, and (b) in 54nm height channel with εwf/εff=1, 2, and 3. LB solution for Tangential Momentum Accommodation Coefficient TMAC=1, and predictions of BKM for TMAC=0.94, 0.9, and 0.75.
Figure 3. Dimensionless velocity profiles for k=1 flows as a function of normalized channel height Y, corresponding to different B values.
Figure 4. Normalized density (a), velocity (b), and mass flux (c) distribution within the wall force penetration region for k=1 flows in different height channels. Figure (a) includes illustration of surface molecules to demonstrate wall penetration into the flow domain.
Figure 5. Free-molecular scaling of MD measured mass flow rates inside 10.8nm height channel compared with predictions of KT and Beskok-Barisik-Correction (BBC) as a function of k.
Figure 6. Snapshots of k=10 flow in a nano-tube of 10nm radius and 150nm length simulated by STMD algorithm.