Reports: DNI1052308-DNI10: Graphene-Integrated Durable Rubber Sealants for Petroleum Exploration
 printer friendly
The graphene was produced by the modified Brodie's method as stated in the previous report. 10 g of graphite was mixed with 85 g sodium chlorate and 160 ml of fuming nitric acid and followed by stirring for 24 hrs. After rinsing, the powder was obtained by oven-dry at 70°C and was tip-sonicated in ammonia solution (pH value of 10.5) to achieve exfoliation. After air-dry at 70oC overnight, and the graphene oxide (GO) powder was obtained. The GO/ammonia solution was further mixed and stirred with hydrazine overnight. The solution was then dried at 70°C to obtain reduced graphene oxide (RGO) powder.
The fluoroelastomer (FKM, Dyneon FC 2260. Composition: di-polymer of vinylidene fluoride and hexafluoropylene.) was enhanced with either GO or RGO. Briefly, 350 g of FKM was mixed with 7 g (2 wt%) graphene nanoparticles (RGO or GO), 8.75 g (2.5 phr) peroxide and 10.5 g (3 phr) Ca(OH)2 by an open twin-roll miller (Oregon Rubber Mill Co., Ltd.) at 80 oC with a friction ratio of 1:1.2 and a nip gap of ~1 mm. The mixed pastes were compressive molded and cured by a hot press machine according to ASTM D3182. The hot-press cure was carried out at 177 oC, 5 MPa followed by a post-cure at 235 oC for 24 hours.
2. RESULTS AND DISCUSSION
TEM (transmission electron microscopy, HITACHI T8100) images in Figure 1 exhibit that both GO and RGO are in thin lamellar structures. As both GO and RGO were transparent (Figure 1 (a) and (b)), they were in single-layer or few layers structure in solution. They are both approximately 700 nm by 900 nm before twin-rolling process.
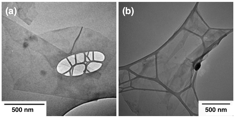
Figure 1. TEM images of RGO nanosheets (a), and GO nanosheet (b). The chemical structures of GO and RGO were investigated by FTIR spectra. As seen in Figure 2(a), the epoxy groups (1390 cm-1, 1060 cm-1, and 946 cm-1), carboxyl group (1260 cm-1, 1720 cm-1, and 3400 cm-1), and aromatics (1560 cm-1) existed in the GO. Compared with GO, the intensities of all oxygen functional groups were significantly reduced in RGO.. The difference of chemical structure of GO and RGO is the concentration of the oxygen groups. The thermal stabilities of the GO and RGO were investigated by the TGA (Thermogravimetric analysis, TA Q50), as shown in Figure 2 (b). The RGO shows stable thermal behavior from room temperature to 550 oC. The GO exhibited significant weight loss at around 240 oC, which is due to the deoxygenating process.
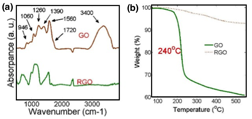
Figure 2. FTIR spectra (a) and TGA spectra (b) of GO and RGO.
The structures of the GO and RGO powders were investigated by the XRD spectra (Fig. 3 (a)). The peaks at 11.68o and 22.78o in the GO spectra represent the interlayer spacing (0.75 nm) and the partially restacked graphite structure (d002). After the reduction, the 11.68o peak was totally removed, indicating most the oxygen groups were removed. The decreased intensity of the G peak (~ 1600 cm-1) and the D band (~1350 cm-1) in the Raman (Bruker) spectra of the GO indicated less defects on graphene due to chemical reduction.
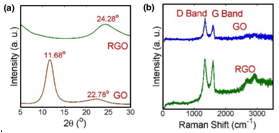
Figure 3. XRD and RAMAN of GO and RGO samples.
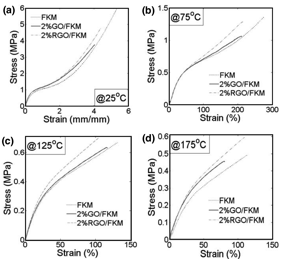
Figure 4. Tensile test results of different FKM nanocomposites at 25 oC (a), 75 oC (b), 125 oC (c) and 175 oC (d).
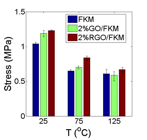
Figure 5 presents the M100 (tensile stress at 100% strain) of each sample at different working temperatures. Although the 2% GO/FKM shows higher modulus than pristine FKM at all temperatures, its enhancement effect decreases significantly when the temperature increasing. This is because the thermal unstable nature of the GO decomposes and weakens the interfacial interaction between GO and FKM when temperature is elevated. The 2% RGO/FKM on the other hand presents stably improvement at all working temperatures.
Figure 5. Comparison of M100 (tensile stress at 100% strain) at different temperatures.
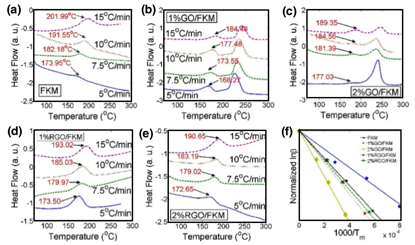
In order to understand their thermal kinetics, 4 different heating rates were measured for each nanocomposite sample according to the Kissinger's method, as presented in Figure 6. The activation energy Eav of vulcanization was calculated in Figure 6(f). The FKM exhibited the lowest vulcanization activation energy, 122.40 kJ/mol. By adding the 2wt% of RGO or 2wt% of GO, the Eav increased to be 196.63 kJ/mol and 301.91 kJ/mol due to the steric effect of graphene. During the free-radical vulcanization, the addition of the graphene nanosheets hinders their diffusion of free radicals and makes the vulcanizing process difficult. In particular, more oxygen groups on the GO get involved in the vulcanization and result in higher activation energy. It illustrates the Eav of FKM can be significantly influenced by both chemical functional groups and weight percentage of graphene.
Figure 6. DSC curves of graphene enhanced FKM samples (a)-(e) and the calculation of the activation energy by estimating from the slope.
3. CONCLUSION In this project, both GO and RGO have been successfully synthesized and applied as reinforcing fillers in FKM composites. Due to the strong chemical bonding between the matrix and graphene, the higher crosslinking degree, and the larger aspect ratio, the graphene reinforced FKM nanocomposites achieves better thermo-mechanical properties. This research is anticipated to bring a breakthrough in next-generation gas/liquid sealant materials that are able to satisfy industrial mass-production requirements and stand up in harsh environments for petroleum exploration.