Reports: UR751997-UR7: Photochemical Control of Nanoparticle Aggregation
 printer friendly
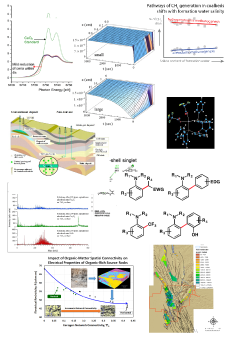
For a thermally equilibrated system, there are eight possible geometric isomers of MC. Studies have demonstrated both zwitterionic and quinoidal character for the MC structure. Isomers with the trans configuration about the β bond (TTT, TTC, CTT, and CTC) are strongly favoured based on quantum chemical calculations, time-resolved emission spectroscopy and NMR. Here we used electrospray ionization (ESI) ion mobility-mass spectrometry (IM-MS) to examine both equilibrated and irradiated samples of spiropyrans 1-3 in methanol (Scheme 1) to gain further experimental insight into the photoisomerization.
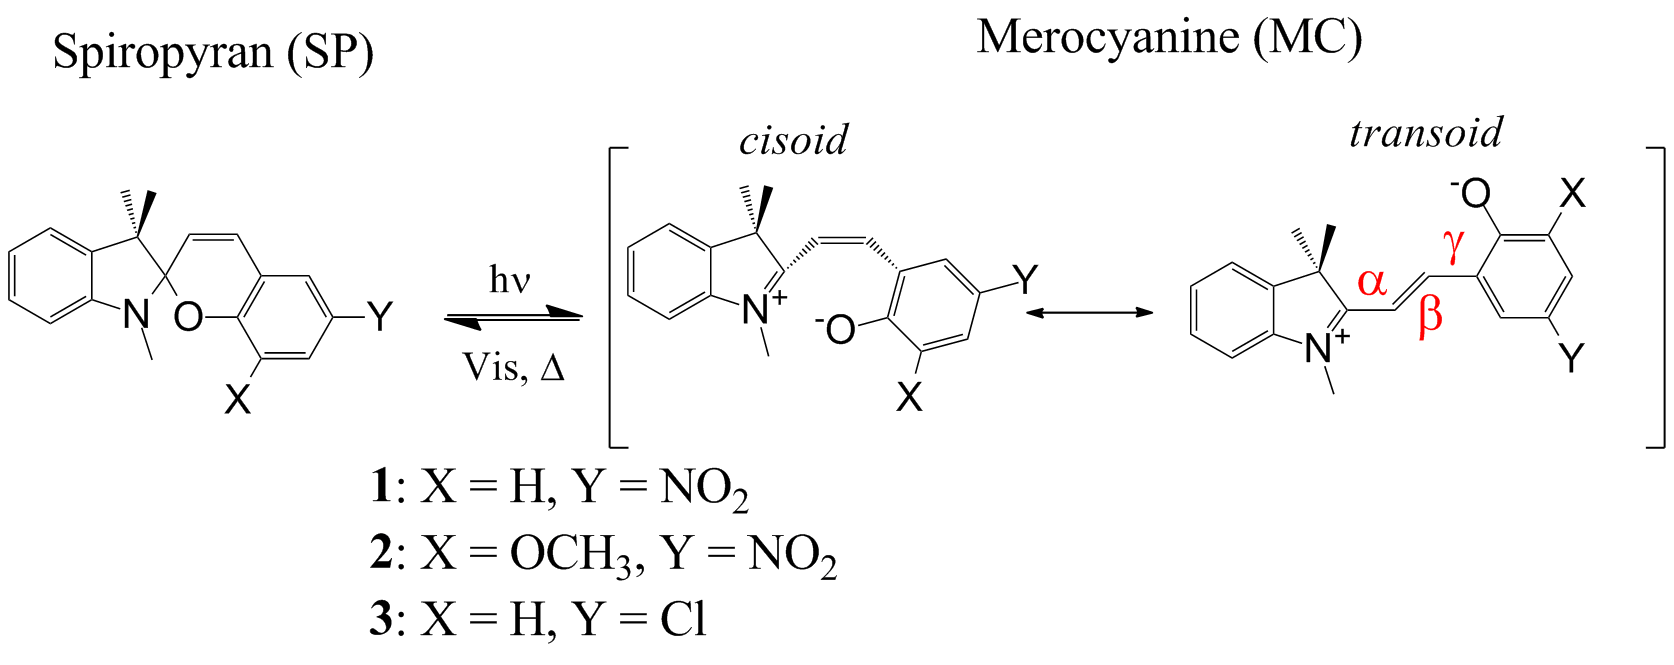
Scheme 1 General Structures of SPs 1-3 and their corresponding MCs.
IM-MS provides information on the molecules’ shapes and sizes based on collision cross-section (CCS), in addition to mass and compositional information. Our interpretation of the IM-MS experimental data argues for presence of a long-lived (>milliseconds) CCX (refers to two of the four MC isomers with cis configuration at the central bond) isomer of MC. The lifetime of this proposed species is considerably longer than the sub-nanosecond lifetimes reported previously.
SP-1 is commercially available and SP-2 and SP-3 were prepared according to literature. Each sample was measured under three conditions: 1) dark equilibration for ~24 hours, 2) UV irradiation (300-400 nm), and 3) visible irradiation (>400 nm). The irradiation was performed ex-situ for two minutes per fresh sample in a quartz cuvette and then transferred and injected via syringe immediately (< 1 min) after treatment. Cartesian coordinate input files for CCS calculations were determined from DFT-B3LYP optimized geometries† using the 6-31++G(d,p) basis set.
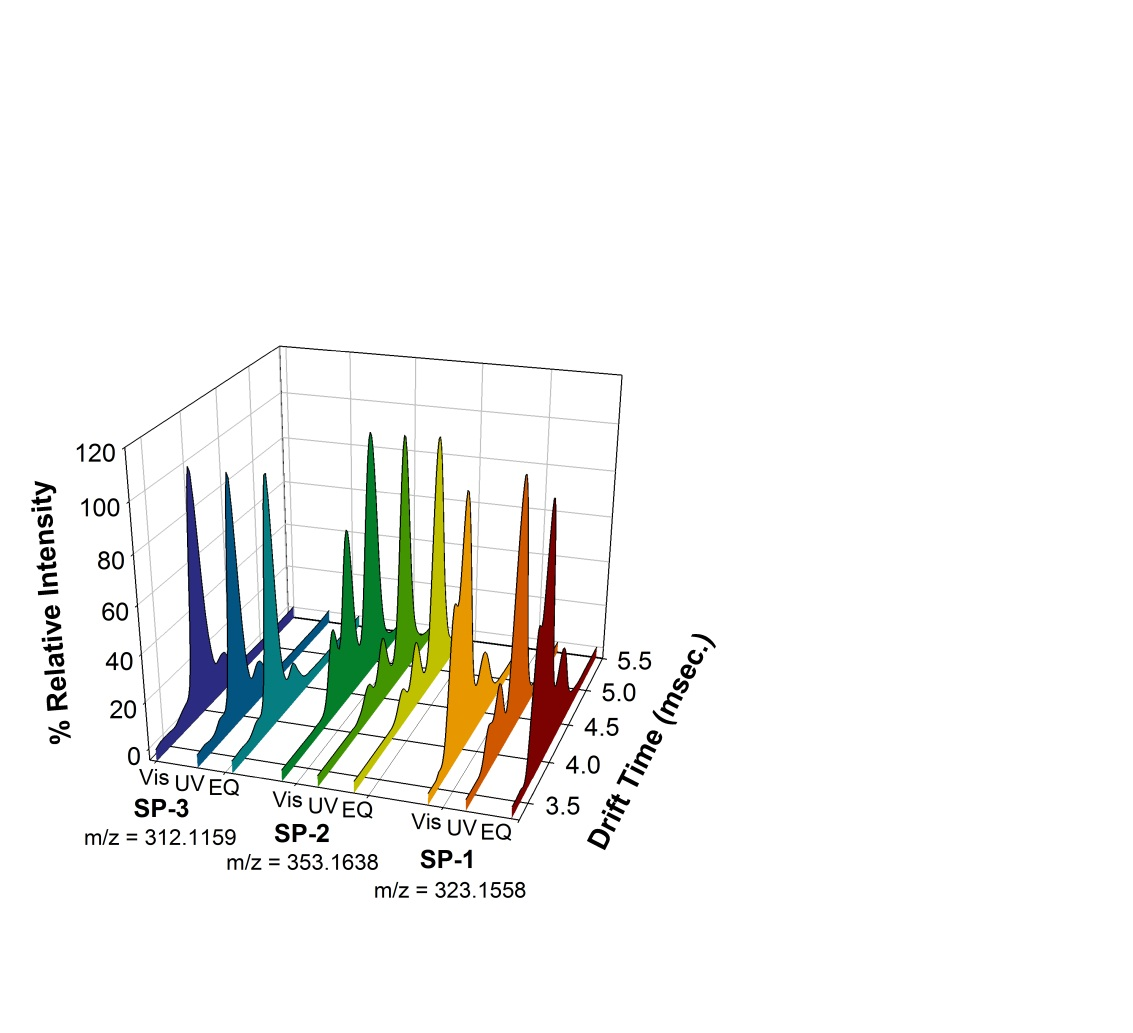
Fig. 1 Experimental IM-MS Data. Vis, UV, and EQ denotes visible irradiation (>400 nm), UV irradiation (300-400 nm) or equilibrated sample.
Figure 1 displays a summary of the IM-MS data. General observations from the IM-MS data include: 1) all SP compounds studied display three peaks corresponding to three isomeric monomers, in order of increasing drift times (tD), 2) the percent relative intensity of each peak is dependent on sample treatment, and 3) the difference in drift time between peaks 2 and 3 is 1.4-2.5 times larger than the difference between peaks 1 and 2. Figure 2 shows the IM-MS spectra of SP-1 at equilibrium and after irradiation at visible or UV wavelengths. Three singly charged monomer peaks corresponding to SP-1 were identified based on identical isotopic patterns, which clearly showed the existence of discrete isomers instead of a doubly charged dimer or triply charged trimer. Upon irradiation by visible or UV light, the abundance ratio of the isomers changed significantly for SP-1. The same measurements were performed for SP-2 and SP-3 and similar figures are included with the supplementary information.
The CCS values, given in Table 1, for each derivative were calculated by MOBCAL using the projection approximation (PA) and trajectory (TJ) methods. Specific isomers observed in Fig. 1 were assigned by comparison of the CCSs to experimental drift times (isomer population data is provided as supplementary information). This comparison also assumes a linear relationship between CCS and tD. We have omitted TCT in our analysis based on the literature and omission of the TCC isomer was based on our DFT optimizations. Thus, the remaining 7 isomers (6 MC isomers and SP) fall into two groups: the SP-CCX isomer group and the XTX isomer group.
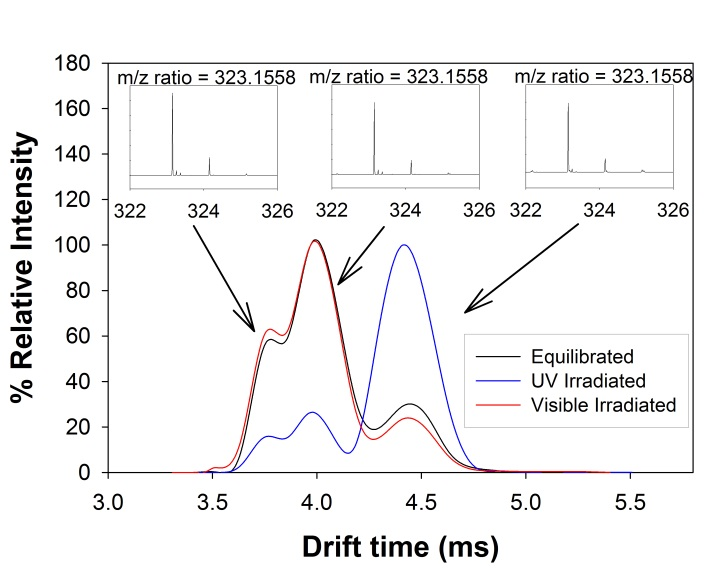
Fig. 2 Example of IM-MS data with identical isotopic patterns for singly charged SP-1 ions, corresponding to isomeric structures. Similar plots for SP-2 and SP-3 can be found in the supplementary information.
We assign peaks 1 and 2, with smaller tD, to the SP-CCX group. The small difference in theoretical CCS prohibits specific assignment to SP vs. CCX. We assign peak 3 to the XTX isomer group due to its larger CCS. Changes in peak intensity with irradiation support our assignments. For SP-1 and -2, the intensity of peaks 1 and 2 decrease with UV irradiation and increase with subsequent visible exposure in contrast to SP-3 where little change is observed. These observations are consistent with literature values for the rate of thermal ring-closure (k) from MC to SP where: k(SP-3) ≈ 50x k(SP-1) ≈ 2-6x k(SP-2). If we use experimental studies in solution as a guide, we speculate that the identity of the XTX isomer is TTC. The assignment of CCX to an intermediate with a lifetime of milliseconds is controversial. Based on transient absorption studies, CCX species have lifetimes well below milliseconds on the photochemical reaction pathway which would make detection difficult under our experimental conditions.
Based on our results, we conclude that the likely reaction pathway is: SP ⇋ CCT/CCC ⇋ TTC/CTC. Mechanistic elucidation of the elementary steps in SP-MC isomerization has been largely limited to transient spectroscopy and model systems. The combination of ESI with IM-MS provides additional information on the structure-dynamics of this important photochromic system.
Table 1 MOBCAL collision cross-sections (Å2) of SP’s 1-3 using projection approximation (PA) and trajectory (TJ) method based on DFT optimized structures.
|
SP-1 |
SP-2 |
SP-3 |
|||
Isomer |
PA |
TJ |
PA |
TJ |
PA |
TJ |
SP |
113.30 |
113.27 |
120.66 |
122.69 |
115.54 |
111.74 |
CCC |
114.63 |
117.45 |
122.57 |
124.13 |
116.82 |
114.48 |
CCT |
112.76 |
113.57 |
121.50 |
122.35 |
114.86 |
112.78 |
TTC |
119.38 |
118.55 |
128.24 |
127.28 |
121.54 |
115.85 |
CTC |
119.71 |
118.29 |
128.63 |
128.27 |
121.96 |
116.37 |
TTT |
119.46 |
117.83 |
128.33 |
126.56 |
121.58 |
115.38 |
CTT |
119.56 |
117.97 |
128.36 |
127.48 |
121.82 |
116.07 |