Reports: ND951836-ND9: Multiscale Modelling of the Interface of Model Crude Oils with Water
 printer friendly
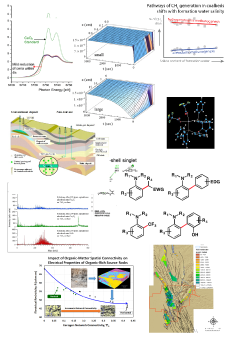
Oil water interfaces have a wide variety of important applications ranging from the understanding of oil spills to enhanced oil recovery. As crude oil is a highly complex mixture it is informative to use well controlled model mixtures to address this problem in detail. Currently we focus on simulations of salt water with the lighter components of crude. The most abundant light components are alkanes and aromatics. As these types of molecules are strongly different in their polarity it is not surprising that there is evidence for interface induced sorting such that the aromatics localize closer to the water phase than the aliphatics. Crude oil has therefore also significantly lower surface tension than pure alkanes of the same density. We are studying in this project currently this effect in detail and for the first time calculate the ensuing surface tension using a detailed molecular model.
Atomistic Simulations
We have first performed detailed Molecular Dynamics simulations with the Gromacs 4.5 package and the CHARMM27 force—field under NpT conditions. The molecules are arranged in slab geometry, i.e. we have a flat oil water interface. The current model systems contain heptane as prototype alkane and toluene as aromatic. We find that the surface tension is only weekly affected by adding salt.
We find that aromatics arrange flat at the interface for both geometrical packing reasons and to optimize the weak electrostatic interactions with water. This is in agreement with our earlier results that toluene enriches at the interface. Water also orients itself at the interface such that its dipole moment right at the interface is normal to the interface again optimizing the electrostatic interactions with the enriched toluene.
Additionally we find that salt is excluded from the interface as the hydrogen bonding structure of the water is severely disrupted making it hard for water to provide an appropriate shell of hydration close to the oil.
Coarse-Grained Simulations
In this final year we mainly focused on coarse-grained simulations using the Martini model
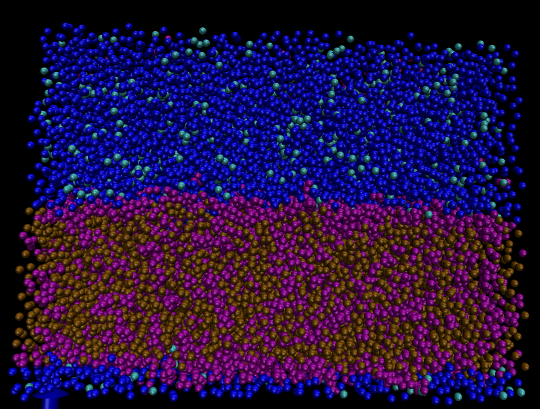
Figure 1: A coarse-grained simulation of oil and water interface.
Figure 1 shows a simple mixture of aromatics and aliphatics where the blue and cyan particles represent the Martini water model (Version 2.0). The purple and brown particles represent benzene and octane molecules, respectively. The oil phase is a mixture of 50 mol percent benzene and 50 mol percent octane. Octane is modeled by two coarse-grained beads, whereas the planar shape of benzene is represented by a triangular arrangement of three coarse-grained beads (see Fig 2). We observe the aggregation of aromatic rings at the oil-water surface in agreement with the earlier atomistic results.
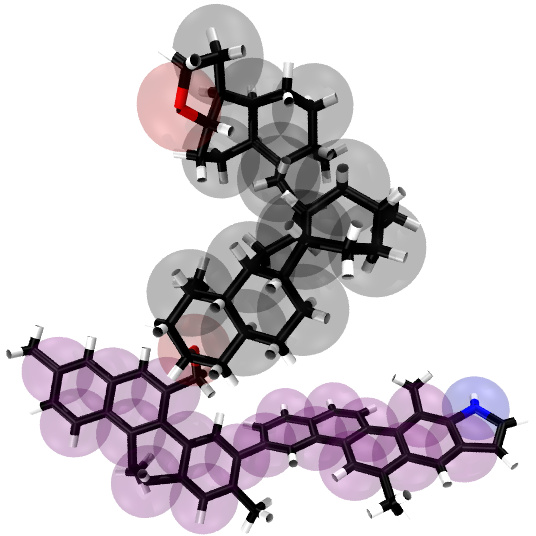
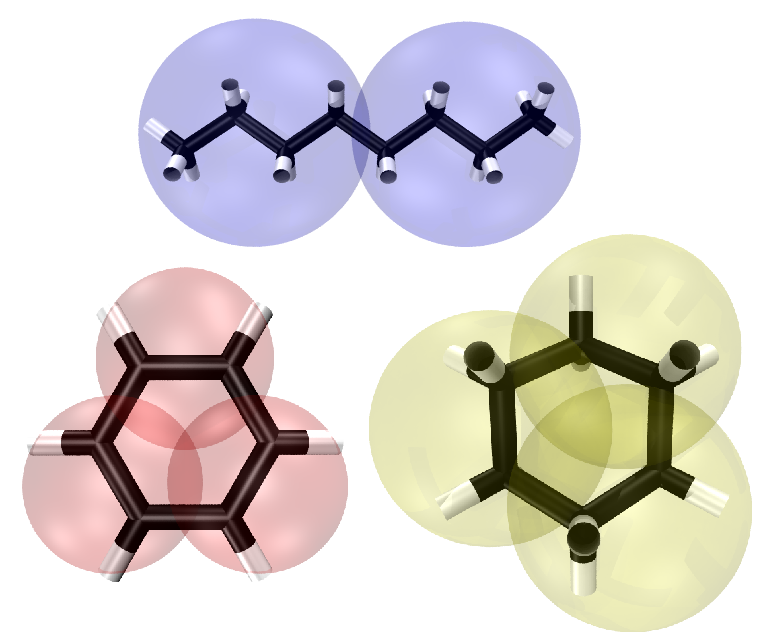
Fig. 2: Left: Coarse-grained representation of compounds of model oil, including: octane (top), benzene (lower left), and cyclohexane (lower right). Each of these compounds represent paraffins, aromatics, and napthenes respectively. The coarse grained beads shown are from the Martini force field v. 2.0 in which octane, benzene, and cyclohexane are composed of C1, SC5, and SC1 beads respectively. Right: Coarse-grained representation of an asphaltene molecule taken from Sisken et al. in Energy & Fuels, 2006, 20, 1227. Black spheres represent fused cycloalkane rings (SC1 Martini particles). Purple spheres represent fused aromatic rings (SC5 Martini particles). Blue and red represent nitrogen and oxygen heteroatoms (represented by SN0 Martini particles).
After the simulation of simple mixtures we added asphaltenes (see Fig 2 right) to the systems at low concentration. The aromatics again aggregate at the interface (Fig 3,4). We also see that there are clearly density heterogeneities (see Fig 3). Figure 5 shows the local pressure profile of this system where the integral of the difference between these two sets of data (transversal and normal) will yield the surface tension of the oil/water interface. The location of the maximums in the lateral tension profile correspond to the oil/water interface of the system.
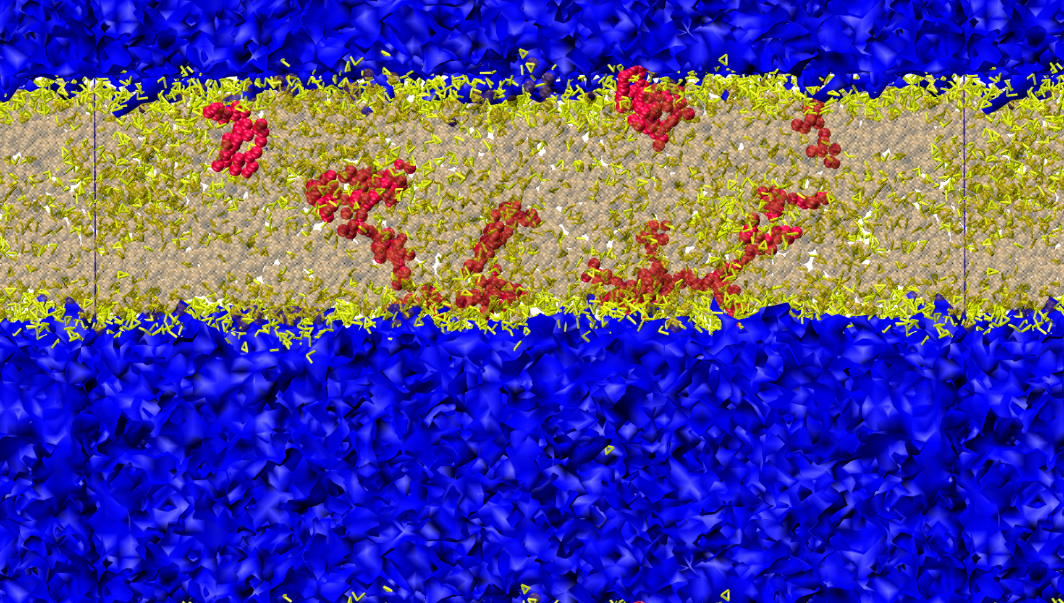
Fig. 3: Snapshot of oil-water interface after 10 ns of simulation time. The oil phase consists of 33 vol. % octane, 33 vol. % cyclohexane, 33 vol. % benzene, and 1 vol. % asphaltenes. The water phase is shown in blue, whereas octane and cyclohexane are shown in tan. Benzene is represented by the yellow sticks, and the asphaltene molecules in red. It can be clearly seen that the aromatics are accumulating at the oil-water interface.
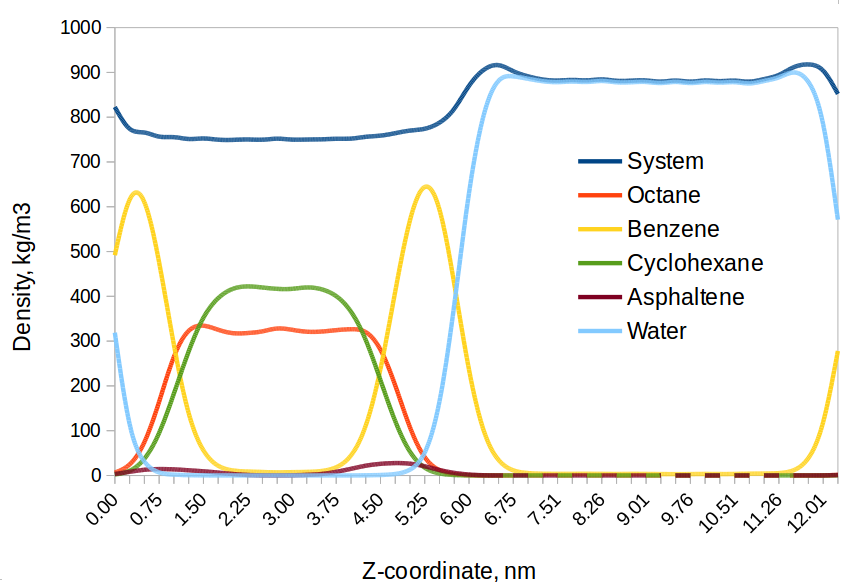
Fig. 4: Density profile of oil-water system after 10 ns of simulation time. The oil phase consists of 33 vol. % octane, 33 vol. % cyclohexane, 33 vol. % benzene, and 1 vol. % asphaltenes.
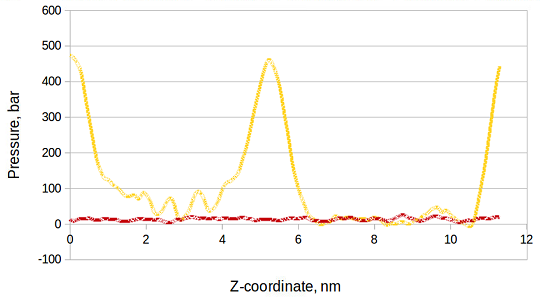
Fig. 5: Local pressure profile of oil-water system after 50 ns of simulation time. The oil phase consists of 34 vol. % octane, 33 vol. % cyclohexane, and 33 vol. % benzene. The lateral local pressure is shown in orange/yellow, whereas the transverse pressure is shown in red.