Reports: UR653163-UR6: Melting of Three Dimensional Colloidal Crystals
 printer friendly
The goal of this research is to better understand the mechanism of three dimensional melting by simulating the melting of colloid sphere suspensions near melting. During the first year we developed computer programs to simulate the colloid system using a Yukawa potential, U(r) = U0exp(-r)/r, with both Monte Carlo and Molecular Dynamics(using the LAMMPS software from Sandia National Laboratories) algorithms. We then identified the metastable region where the melting occurs and explored the behavior of the following quantities: energy per particle, pressure, specific heat, pair correlation function, elastic constants, and the Lindemann ratio. Following the suggestion of David Weitz's group at Harvard (Sprakel, Lu, Angelini, Spaepen, Schall, and Weitz, preprint 2012), which experimentally explored this system, we identified so-called `hot' particles, which have a large Lindemann ratio. If two such 'hot' particles are within a nearest neighbor distance we say they are connected and then can form clusters. We did a cluster analysis to see if the melting transition can be described using percolation theory.
This year we ran constant pressure and some constant volume Monte Carlo simulations using N = 16,000, 2000 and 250 particles at a dimensionless temperature (kT/ U0 ) equal to 6.3 x 10⁻⁴, where there is some existing data in the literature (Meijer and Frenkel, J. Chem. Phys. 94, p. 2269, 1991), and where it is similar to the physical parameters of the system used by the Harvard group.
We have found that thermodynamic quantities such as the mean energy, mean volume, and specific heat are not useful for locating a transition. There appears to be a broad peak in the specific heat and other thermodynamic quantities change smoothly through the transition. In contrast our simulations of the Lennard-Jones potential show clear cut steps in the energy and volume at the melting transition.
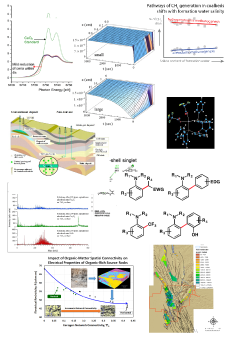
Two quantities do help us determine the state of the system. One is the pair correlation function, g(r). We compute both the usual spherically averaged g(r) as well as along a specific direction g(x). In the fluid state these are the same as shown in Figure 1, but in a crystal g(x) will show regularly spaced peaks which are much larger than the peaks in g(r) as shown in Figure 2. A second quantity is the orientational order parameter Q6, which is an average over spherical harmonics where the angle in the spherical harmonic is the angle made by the line between a particle and a nearest neighbor. In a crystal this quantity typically has a value between 0.34 – 0.37 for a BCC lattice interacting through a Yukawa potential and 0.42-0.47 for an FCC lattice with Lennard-Jones pair interactions. In the liquid this quantity approaches zero.
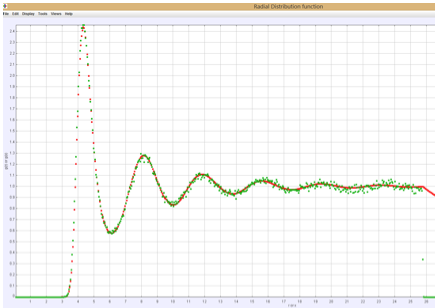
Figure 1: Liquid g(r) and g(x). Notice they are equal.
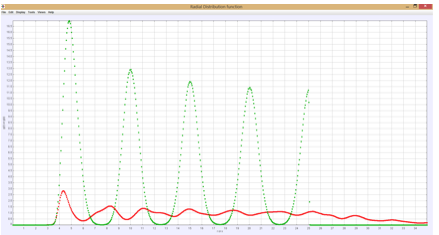
Figure 2: Crystal g(x) large green peaks and g(r) red curve.
We have done extensive calculations of percolation quantities, where the “hot” particles are those particles whose distance from their lattice sites are greater than a certain value, which usually was 0.22 a, where a is the lattice constant. The most informative data is for the cluster size distribution ns, equal to the number of clusters with s “hot” particles. At the percolation transition ns should follow a power law in s, and thus a log-log plot would show a straight line. Below and above the transition the ln(ns) vs ln s plots are curved and near the transition show a power law for small s with a large s exponential cutoff.
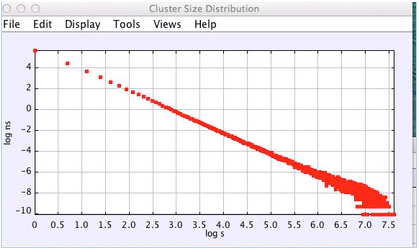
Figure 3: Cluster distribution very close to the phase transition, showing a power law behavior. N = 16,000.
The scenario suggested by percolation theory is consistent with the results we obtain. Figure 3 shows the distribution very close to the transition. The power law exponent is slightly larger than 2 consistant with percolation in 3d where this exponent is approximatedly 2.19. Figure 4 shows the cluster distribution in the crystal state before melting. Fitting to a power law times an exponential cutoff exp(s/s0), we find the power to be 2.06 and the cutoff is about s0 = 73. Figure 5 shows the cluster distribution after the system begins to melt, where one can see the development of very large clusters. Actual melting where g(r) does not equal g(x) and the orientational order parameter becomes very small occurs at lower pressures thatn the apparent percolation transition. Thus, the percolation transition may be a precursor to the thermodynamic melting. Further work needs to be done to compute the free energy to determine more precisely the thermodynamic melting point.
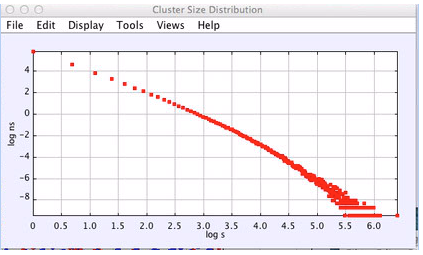
Figure 4: Cluster distribution in the crystal phase near melting. N = 16,000
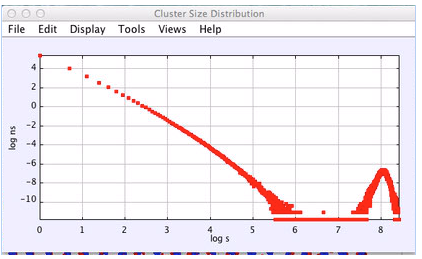
Figure 5: Cluster distribution as the system melts, showing some very large clusters spanning the system and the small cluster distribution, which does not follow a pure power law. N = 16,000.
There have been two students working on this project this past summer, Zach White and Abhay Goel. In addition Takumi Matsuzawa, who worked on the project the previous year provided some assistance to these students to help them get started. Zach is beginning his junior year and plans on a career in engineering and Abhay is beginning his sophomore year.
During the past year I spent consider time working on the research and have had discussions with my colleague Harvey Gould, who has done some work on the project. My hope is to write up our results this year and submit a paper for publication.