Reports: UNI1054205-UNI10: Methane Adsorption in Dry and Wet Micro-Mesoporous Carbon
Dipendu Saha, PhD, Widener University
(A) Synthesis activated micro-mesoporous carbons:
50 g resorcinol and 40 g F127 was dissolved in 20:1 ratio of water and ethanol and resorcinol was cross-linked with 48 mL formaldehyde along with 60 mL 6 M HCl as catalyst. Upon separating the polymer layer from solvent, it was carbonized under nitrogen flow in a porcelain boat in the specified conditions of 0 °C to 400 °C in 1 °C/min and 400 °C to 1000 °C in 2 °C/min and cooling down in same nitrogen flow. The resultant mesoporous carbon was mixed with solid KOH in 1:3 ratio and heated in a porcelain boat up to 800 °C in nitrogen flow at 10 °C/min and cooling down in same atmosphere. The KOH activated carbon was washed with deionized water several times till the pH of wash water is close to 7.0.
(B) Protocol for characterization and low-pressure adsorption studies on carbons:
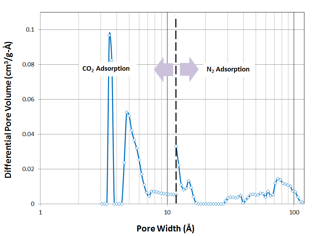
The carbon material was examined with pore textural analysis by N2 adsorption-desorption at 77 K and CO2 adsorption-desorption at 273 K Quantachrome's Autosorb iQ instrument. Pore size distribution was calculated by non-local density functional theory (NLDFT) by analyzing adsorption plots. Larger micropores, above 15 and mesopores were calculated based on N2 adsorption whereas the narrower micropores, below 15 were calculated by analyzing the CO2 adsorption isotherms.
(c) Results:
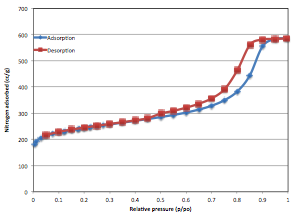
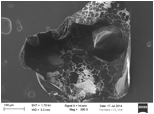
The pore textural properties of this activated mesoporous carbon are calculated from nitrogen adsorption-desorption plot at 77 K and shown in table 1. Quite obviously, it has the BET specific surface area of 786 m2/g and total pore volume of 0.86 cm3/g and isotherm is of type IV according to BDDT classification. (figure 1). The pore size distribution plot of this carbon (figure 2) is obtained by combining the individual plots from CO2 adsorption at 273 K and nitrogen adsorption at 77 K, before and after 12 of pore width, respectively. The activated mesoporous carbon has a large mesopore distribution in the range of 30 to over 100 and a small micropore distribution in 4-5 . SEM images of these materials demonstrate that it is disorderly shaped material with size in the range of 400 to 500 μ (figure 3).
Table 1. Pore textural properties
Adsorbent |
BET SSA (m2/g) |
Micropore Volume (cm3/g) |
Total Pore volume (cm3/g) |
Activated micro-mesoporous carbon |
786 |
0.26 |
0.86 |
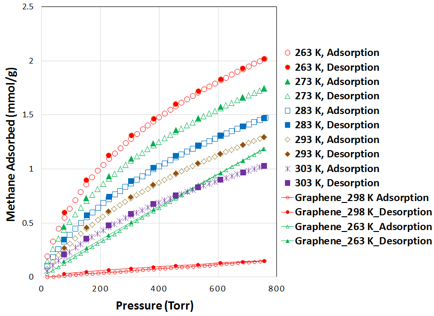
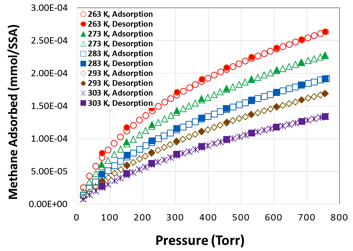
Low-pressure methane adsorption isotherms on activated micro-mesoporous carbon are shown in figure 4. The adsorption uptakes were measured in the five temperatures of 263 K to 303 K in 10 K difference, and pressure up to 760 Torr (~1 bar). At near ambient temperature (293 K), the gravimetric methane uptake was 1.29 mmol/g for this carbon. In order to compare the methane uptake with nanographene samples, we have plotted methane adsorption in nanographene at 298 K and 263, which are both lower than that of activated mesoporous carbons. In order to provide more light on the adsorption properties of thee materials, we have plotted the surface area based uptake (mmol/SSA) with BET surface area as the reference (figure 5) and this material demonstrated about 2.7 mmol/m2 of methane uptake.
We employed the isotherms at five temperatures to calculate heat of adsorption (
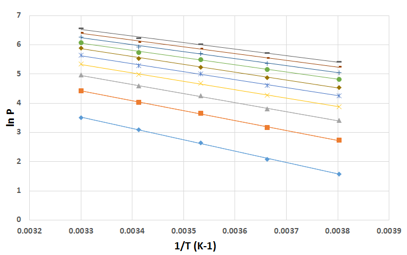
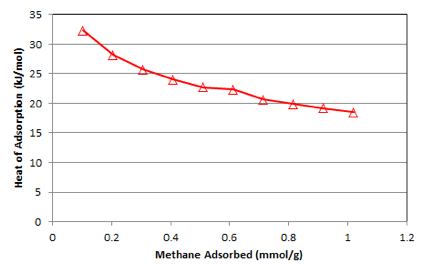
where C is the constant of integration. A series of isosteres are plotted at preselected adsorption amounts and from the slope of the isosteres, the heats of adsorption values were calculated as a function of adsorption amount (a). The set of isosteres and heat of adsorption plots are shown in figure 6 and 7. The heat of adsorption plot demonstrates the decreasing trend with the increase in adsorption amount suggesting heterogeneous surface. The heat of adsorption of this was in the range of 32 to 28 kJ/mol. It was suggested that heat of adsorption can be correlated with a virial type of model equation[1] given by
where ![]() is the adsorption amount and x1, x2, x3 and x4 are constants. We calculated the constant values with 99% regression fits and they are given in table 2.
is the adsorption amount and x1, x2, x3 and x4 are constants. We calculated the constant values with 99% regression fits and they are given in table 2.
Table 2. Values of heat of adsorption model fits.
Adsorbent |
x1 |
x2 |
x3 |
x4 |
Activated micro-mesoporous carbon |
36.6 |
-2.22 |
0.11 |
-0.0022 |
The kinetics of methane adsorption for each of the adsorbents are measured in each of the five temperatures of 263 to 303 K in low pressure mode. The representative kinetic data at -263 K are show in figure 8. We found that all the kinetic data fit very well pseudosecond order equation with more than 99% regression fit. The pseudosecond order equation is given by [2]
where, qt, qe,2 and k2 are uptake amount at time t, and pseudosecond order equilibrium constant, respectively. equilibrium uptake. Integration of above equation yields
The pseudosecond order equilibrium constant ( ![]() ) can be calculated from the linear plot of t versus t/qt. The equilibrium constant can be related to temperature in Arrhenius type if equation given by
) can be calculated from the linear plot of t versus t/qt. The equilibrium constant can be related to temperature in Arrhenius type if equation given by
where E is the activation energy. Table 3 shows the values of pseudosecond order equilibrium constant and activation energy for the three adsorbents.
Table 3. Properties of methane adsorption kinetics
Kinetic Constant |
Temperature |
MesoC1 |
k2 (mmol/g) |
263 K |
50 |
273 K |
73 |
283 K |
132 |
293 K |
172 |
303 K |
286 |
Figure 1. N2 adsorption-desorption plot activated micro-mesoporous carbon at 77K
Figure 2. Pore size distribution plot of activated micro-mesoporous obtained by non-linear density function theory (NLDFT)
Figure 3. Scanning Electron images of activated micro-mesoporous
Figure 4. Gravimetric methane adsorption plots at 263 – 303 K and pressure up to 800 torr
Figure 5. surface area based methane adsorption plots at 263 – 303 K and pressure up to 800 torr
Figure 6. Isosteres of methane adsorption obtained from the methane isotherms
Figure 7. Heat of adsorption plot of methane in activated micro-mesoporous carbons
Figure 8. Kinetic plot methane adsorption at 263 K
[1] He, Y.; Seaton, N. A. Heats of Adsorption and Adsorption Heterogeneity for Methane, Ethane, and Carbon Dioxide in MCM-41. Langmuir 2006, 22, 1150–1155.
[2] J. Chem. Eng. Data 2011, 56, 4919–4926

