Reports: ND554684-ND5: Spectro-Electrochemical Microscopy of Single Nanoparticle Electrocatalysts
Christy F. Landes, PhD, Rice University
The objective of this project is to
correlate the catalytic activity of gold nanoparticle electrocatalysts with
nanoparticle morphology and surface chemistry for the reduction of CO2
using single particle spectro-electrochemical microscopy.
Our project’s central hypothesis is that the catalytic activity of gold
nanoparticle electrocatalysts strongly depends on size, shape, crystal facet
and surface chemistry, and that possibly only a few catalytic 'hot spots'
dominate the signal in ensemble measurements. The project goals are: (1)
Establish the relationship between the electron density of a single gold
nanoparticle and the induced spectral changes of the plasmon scattering
response (wavelength maximum, intensity, linewidth) as a function of nanoparticle
morphology. (2) Determine the catalyst activity for the CO2
reduction using different gold nanoparticle electrocatalysts. (3) Identify the
spatial extent of active catalytic sites on single gold nanoparticles using
super-resolution electrochemical luminescence (ECL) microscopy.
We have made considerable progress
on both our first goal and our project hypothesis. We have achieved
reproducible and reversible electrochemical tuning of the plasmon response in
gold nanoparticles in a three electrode cell with sodium chloride as the
electrolyte. Additionally, our hyperspectral setup allows us to collect either time-resolved
spectra as a function of cell potential or spectra from multiple nanoparticles
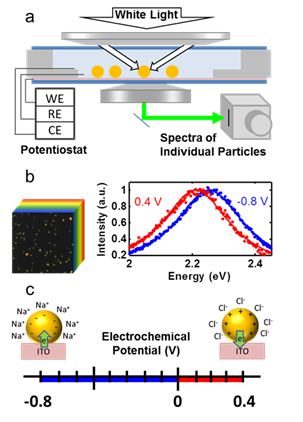
simultaneously at a constant potential. Figure 1 shows the
spectroelectrochemical setup (a) and model hyperspectral image (b, left) as
well as voltage dependent single particle spectra (b, right). Below, in (c) are
shown cartoons of the electrochemical range and Stern layer chemistries.
Potential-dependent hyperspectral
imaging gave us the means to observe heterogeneity within a nanoparticle
population (Figure 2).A series of hyperspectral images at each
potential was used to identify the steady-state potential induced plasmon
resonance shift. Figure 2a shows an example spectral image compiled at open
circuit potential, with circled nanoparticles noting subsets identified by
their potential-dependent spectral behavior. Each scattering center in the
series was located and fit with a single Lorentzian function. Single gold
nanoparticles were distinguished from clusters by imposing a coefficient of
determination cutoff, R2 > 0.95. Because we achieved a large
signal-to-noise ratio, spectra were well-fit. Shifts as small as 1 meV were
detectible.
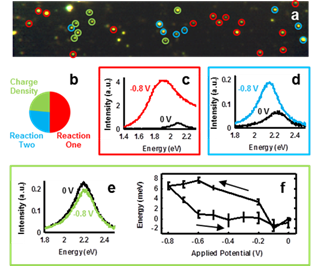
Figures 2b-e support our project
hypothesis that within each sample of nanoparticles are heterogeneous surface
chemistries that can dominate catalytic response. By investigating many
nanoparticles under potential control in this cathodic range (0 to -800 mV), we
found that themajority of nanoparticles demonstrated behavior not
predicted by charge density tuning, as shown in Figure 2b. If charge density
tuning were the only mechanism, the plasmon resonance of all gold nanoparticles
would blue shift linearly upon application of negative electrochemical
potentials, due to an increase in free electron density that results from
electrons flowing from the potentiostat circuit into the nanoparticles and
substrate in establishing the electrical potential difference between the bulk
electrolyte and the nanoelectrodes. However, spectra for half of the single
gold nanoparticles that met the selection criteria (R2 > 0.95)
showed significant irreversible changes in their scattering spectra including
significant resonance broadening, large increases in scattering intensity, and
the loss of their original Lorentzian response. These nanoparticles are
highlighted with red circles in Figure 2a and representative spectra at the
potential vertices are shown in Figure 2c. We attribute this to an
electrochemically irreversible reaction underpotential reaction, probably with
ions from the reference electrode, as the chemical identity (silver vs.
platinum) was found to influence the prevalence of such reactions (data not
shown).
One-fourth of the nanoparticles
also showed large increases in intensity, spectral broadening, and plasmon
resonance red shifts not predicted by the charge density tuning model. The
scattering spectra of nanoparticles in this subset maintained their Lorentzian
line shape throughout the entire experiment, but their scattering spectra only
returned to initial conditions after the application of a sufficient positive
potential. These nanoparticles are highlighted by cyan circles in Figure 2a and
example spectra are shown from a single nanoparticle in Figure 2d. Further
investigations are required to elucidate the mechanisms and potentially complex
behaviors reported in Figures 2c and d.
Just under a quarter of the single
gold nanoparticles followed the predicted charge density tuning model, indicated
by green circles in Figure 2a and example spectra from a nanoparticle in this
subset in Figure 2e. Nanoparticles in this subset were well-fit throughout the
experiment (R2 > 0.95), show small changes in FWHM (ΔΓ
< 20 meV) and demonstrated completely reversible plasmon resonance shifts.
The change in peak resonance energy as a function of potential for this subset
of nanoparticles is shown in Figure 2e as a mean resonance shift with
associated standard error for all nanoparticles in this subpopulation. The
return to initial resonance energy is a strong indicator that the spectral
tuning mechanism for this subset of nanoparticles is electrochemically
reversible, fitting the charge density tuning model.
The most valuable electrochemical
techniques are not steady-state techniques, but rather are dynamic in nature.
The ability to precisely and quickly vary the potential at an electrode surface
allows researchers to characterize electrodes, investigate fine potential structure,
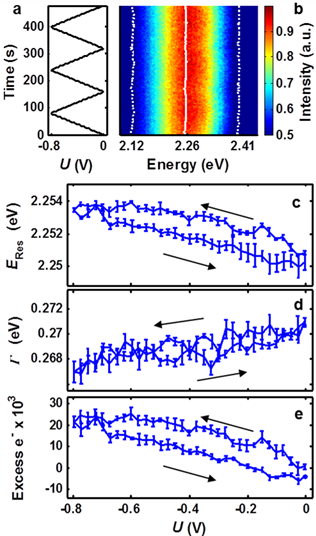
and determine reaction kinetics. Thus, we developed dynamic single-particle
spectroelectrochemistry (Figure 3). The potential was swept in a sawtooth
pattern at 10 mV/s between 0 and -800 mV, as shown in Figure 3a. Scattered
light from a single nanoparticle was directed to the spectrograph and spectra
were recorded every 2.5 seconds. Each spectrum was independently fit with a
single Lorentzian and the parameters of the fit determined the resonance
energy, ERes, and full width at half maximum, Γ. ERes
and Γ are shown in Figure 3b as solid and dashed white lines,
respectively. The reversible spectral tuning shown in Figure 3 is consistent
with the charge density tuning model.
In summary the mechanisms
underlying spectroelectrochemical tuning of the plasmon resonance vary from
nanoparticle to nanoparticle. The methodology developed in Year 1 allows in-depth
study of the multiple mechanisms by measuring the effects of other
electrolytes, ion concentrations, nanoparticle morphology and size, potential ranges,
and electrode materials on the catalytic efficiency of individual and
distributions of nanoparticles.
 printer friendly