Reports: DNI954621-DNI9: Advanced Characterization of Hydrate and Emulsion Formation in Flowing Systems for Flow Assurance Applications
Clint P. Aichele, Oklahoma State University
- Quantify drop size distribution of water-in-oil emulsion in quiescent and flowing conditions.
- Investigate rheological behavior of emulsions.
- Quantify hydrate formation in emulsified system using flow loop.
- Investigate rheological behavior of hydrate forming emulsions.
- Investigate the effect of system temperature and pressure, flow rate, and surfactant concentration on hydrate formation.
- Quantify hydrate attachment on surfaces.
Experimental Methods
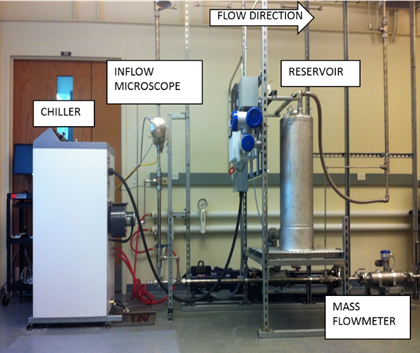
A flow loop equipped with a Canty inflow microscope (JM Canty Inc.) was used for characterizing emulsion droplet size and distribution, morphology of the droplets, behavior of solid particles at the interface, and hydrate formation under flowing conditions.
Figure 1.Schematic of the experimental flow loop setup equipped with an inflow microscope.
A Linkam CS 450 optical microscope equipped with a temperature control shear stage was used for measuring drop size distribution of emulsions and hydrate morphology. The temperature control stage can operate in the range of -50 °C to 450 °C and up to a maximum shear rate of 7500 s-1.
A stress-controlled discovery hybrid rheometer (DHR-3 Rheometer) equipped with peltier temperature control in the operating range -20°C to 150°C was used for measuring stress-strain relationship of emulsions.
The proposed work was carried out on two model oils (crystal plus 70T and light mineral oil). For solid stabilized emulsions, fumed silica nanoparticles (Aerosil R972 and Aerosil R974) (provided by Evonik Inc.) were used. For surfactant stabilized emulsions, non-ionic surfactant, Span80 (sorbitan mono-oleate) (purchased from Sigma Aldrich) was used as a stabilizer. The effect of water fraction, stabilizer type and concentration, and mixing condition on drop size distribution was evaluated for the emulsions.
3. Results
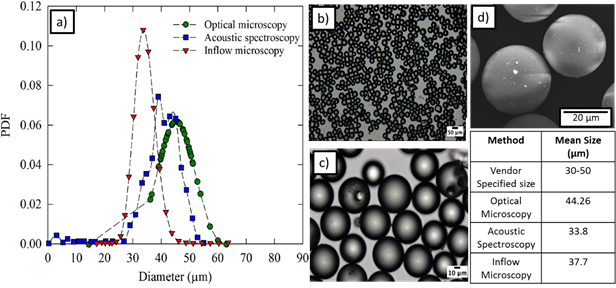
Figure 2.a) Comparison of glass beads particle size distribution (psd) using different techniques b) and c) optical microscopy image of glass beads suspension d) Scanning electron microscopy image of 0.1 wt% glass beads suspension.
To confirm the performance of the inflow microscope, the particle size distribution of glass beads was measured in the flow loop. For this work, glass beads were purchased from Polysciences Inc. with a vendor specified mean diameter in the range of 30-50 µm.
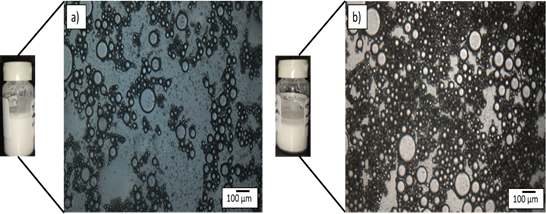
Figure 3.Emulsion morphology of 30 vol% water-in-oil emulsion stabilized using surfactant a) control (doesn’t contain hydrate forming guest molecule (cyclopentane) in the oil phase) b) hydrate forming emulsion (oil phase contains 50:50 mixture of oil and cyclopentane).
Figure 3 represents drop size results obtained from optical microscopy for a hydrate forming emulsion and its corresponding control sample at quiescent conditons. The mean droplet size of the control and hydrate forming emulsion were observed to be 32 and 27 µm respectively.
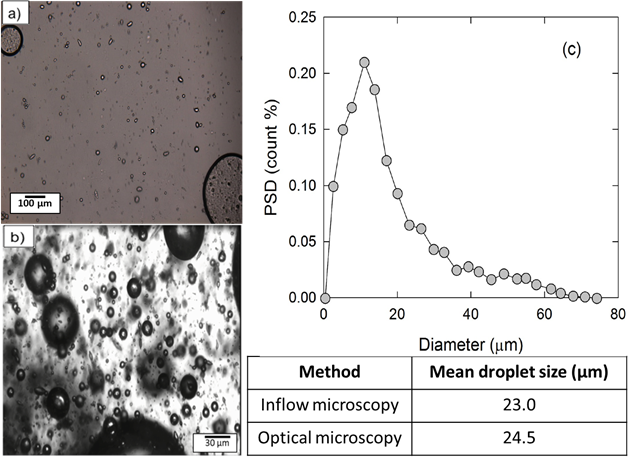
Figure 4.Solid particle stabilized 30 vol% water-in-oil emulsion measured using a) optical microscopy b) flow loop c) drop size distribution from inflow microscope (flow loop).
Figure 4 compares the drop size distribution of a water-in-oil emulsion at quiescent and flowing conditions. The flow loop was operated at three different flow rates (3.3, 4.9, and 6.6 gpm) and two process fluid temperatures (25, 15 °C).
Task 2: Quantification of Hydrate Formation in Emulsified Systems
Figure 5.a) Emulsion morphology in the cyclopentane hydrate formation zone b) Reservoir top view of the emulsion after hydrate formation c) Emulsion morphology immediately after hydrate formation.
Figure 5 represents images captured from inflow microscope for 15 vol% water-in-mineral oil (Tech80): cyclopentane hydrate forming emulsion. Inflow microscopy was utilized to investigate emulsion morphology before, during, and after hydrate formation.
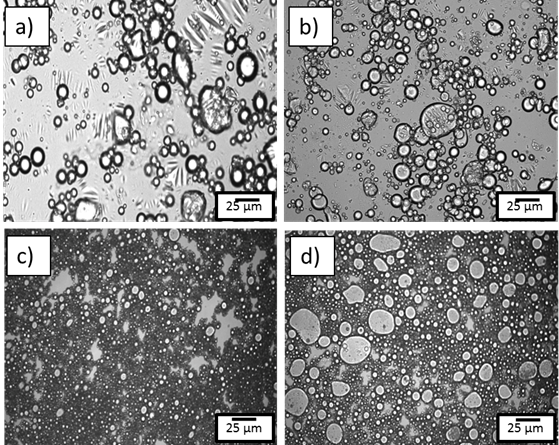
Figure 6.Emulsion morphology photomicrographs obtained from optical microscopy for 40 vol% water in oil emulsion stabilized using a) and b) surfactant c) and d) solid particle. Figure a) and c) represent before hydrate formation and b) and d) after hydrate formation.
Figure 6 shows microscopy images for cyclopentane hydrate forming emulsions using different kinds of stabilizers. For this study, the stabilizer concentration and emulsion preparation conditions were identical. For both surfactant and solid stabilized emulsions, the mean droplet size after hydrate formation increased.
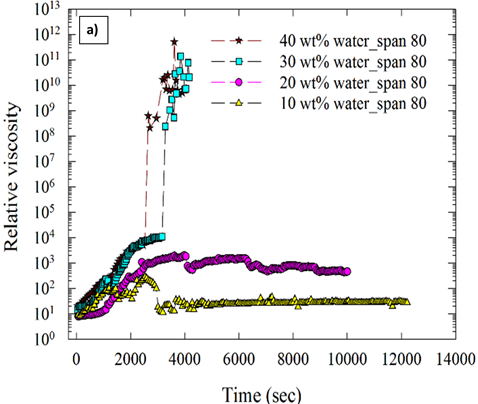
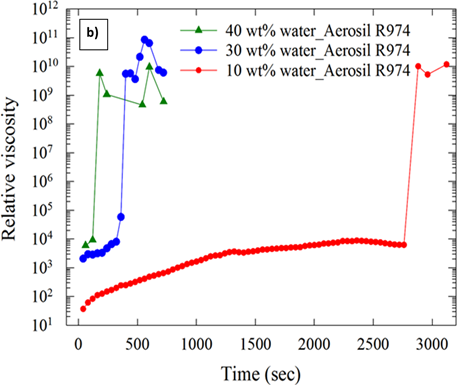
Figure 7.Effect of water cut on viscosity of hydrate forming water-in-oil emulsions stabilized using a) surfactant b) solid particles (Aerosil R974).
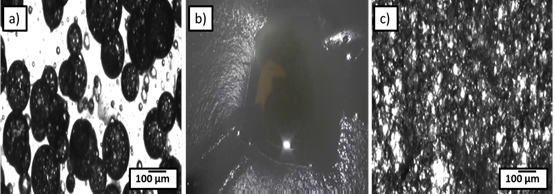
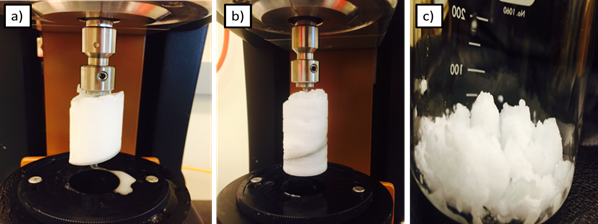
Figure 8.Rheometer jamming caused by 40 vol% water-in-oil emulsion formed using a) 0.1 vol% Span80 b) 0.1 vol% Aerosil R974 c) Bench top hydrate formation in 40 vol% water –in-oil emulsion formed using 0.1 vol% Aerosil R974.
Figure 7 (a) and (b) shows the effect of water cut on the relative viscosity (ratio of viscosity of emulsion and continuous phase) of hydrate forming emulsions. Figure 7 shows that the viscosity of the hydrate forming water-in-oil emulsions was higher at higher water cuts. Increases in viscosity resulted in jamming of the rheometer as shown in Figure 8 (a) and (b). Solid particles enhanced hydrate formation to a greater extent than surfactants at higher water fractions.
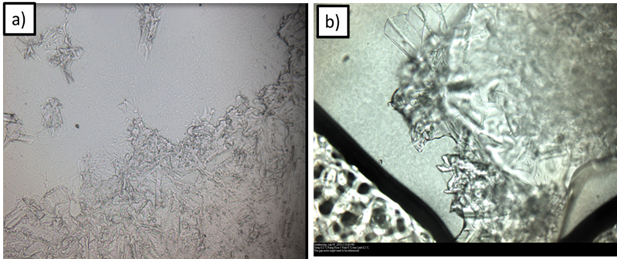
Figure 9.Hydrate formation observed under cross polarized microscope using a) single water drop in pure cyclopentane b) single water drop in cyclopentane and 1 vol% Span80 mixture
Figure 9 shows in-situ hydrate formation in the optical microscope.
Task 3: Hydrate attachment on pipe surface
Currently, modifications to our existing flow loop setup are being made to accommodate experiments for hydrate formation in flowing conditions. This work will be conducted in Phase II of the project.
4. Project Timeline and Deliverables
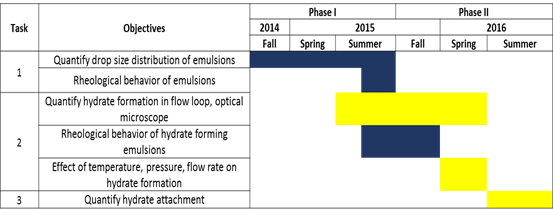
Figure 10.Project timeline and deliverables.
Note: Blue indicates task completed; Yellow indicates task in progress
5. Impact
This project has positively impacted PI-Aichele’s career by providing the opportunity to explore a fascinating area of hydrates and emulsions. The project has facilitated novel research and supported three graduate students, one undergraduate student, and one postdoctoral scholar. The project has provided outstanding research opportunities for these students and introduced them to a rich research area.

