Reports: UR552049-UR5: Synthesis and Multilayering of Poly(4-vinylphenol) Derivatives for Future Applications as Proton Exchange Membranes in Fuel Cells
 printer friendly
Over the past year, the grant on the design of new multilayer materials as proton exchange membranes for possible application into hydrogen fuel cells has advanced nicely. Three significant advances have been accomplished which led to two separate publications (only one in print) and another currently under review. The first was in the determination of the acid–base equilibria of multilayered pseudo-polyelectrolytes (pPE). This is a vital component within our work. One of the driving hypotheses of our awarded grant was that the reason for the high conductivity of our multilayer films was due in part to the similarity in the pKa values of the two polymers employed. To determine pKa values of the multilayered polymers, we employed zeta potential. Briefly, we multilayered poly(4-vinylphenol) (PVPh) and poly[5-(2-trifluoromethyl-1,1,1-trifluoro-2-hydroxypropyl)-2-norbornene] (PNBHFA) with poly(allylamine hydrochloride) (PAH) on Snowtex-ST-ZL silica particles (70-100nm, ~40.5 %wt, pH ~9.5) obtained from Nissan Chemical Industries at a multitude of assembly pH values. Using a Beckman Coulter, Inc. Delsa™Nano C Particle Analyzer with Zeta Cell Assembly equipped with a 30 mW dual laser diode (658 nm), the particles’ electrophoretic mobility values were measured at five regions in the flow cell and a weighted mean was calculated. Scattered light was detected at a 30° angle at 25 °C. The mobility of the particles are converted to a zeta potential (an average of ten points) via the Smoluchowski equation. When graphing the zeta potential vs layer number a sigmodial curve is obtained with the inflection point representing the pKa(app) value. To the eye, termination with PAH or PVPh looks similar (Figure 1 and 2), however when graphing the layer # vs the pKa(app) value a clear change is visualized (Figure 3). As the layer number increases so does the pKa(app) value of PAH. In contrast, as the layer number increases for PVPh the pKa(app) value is lowered. Analyzing the data, for all assembly pH’s there is a point where the pKa(app) values of PAH and PVPh are very close. When assembled at pH 12, PAH has a pKa(app) value of 10.93 at layer 7, whereas PVPh was 10.84 at layer 6. At an assemble pH of 11.5, the closest pKa(app) values were 10.72 (layer 5, PAH) and 10.79 (layer 6, PVPh). However, at an assembly pH of 11.0, exact matching pKa(app) values were obtained at 10.72 for layer 6 (PVPh terminated) and layer 7 (PAH terminate). In addition, we also looked at PNBHFA multilayered with PAH. The final pKa(app) value curve was not what should have been obtained for the polyanion (Figure 4). This was one of the rationales why PNBHFA has ultimately been declassified as a pPE.
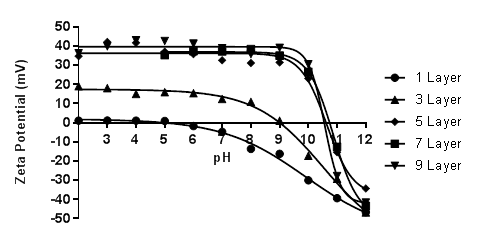
Figure 1: Acid-base equilibria curves for PAH surface layers in PAH/PVPh multilayer films assembled at pH 12.0. Lines are a guide to the eye.
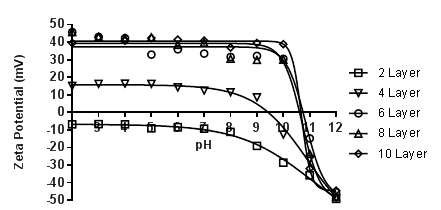
Figure 2: Acid-base equilibria curves for PVPh surface layers in PAH/PVPh multilayer films assembled at pH 12.0. Lines are a guide to the eye.

Figure 3: Apparent dissociation constant (pKa(app)) as a relation to total layer number in a PAH/PVPh multilayered system assembled at pH = 12.0. Lines are a guide to the eye.
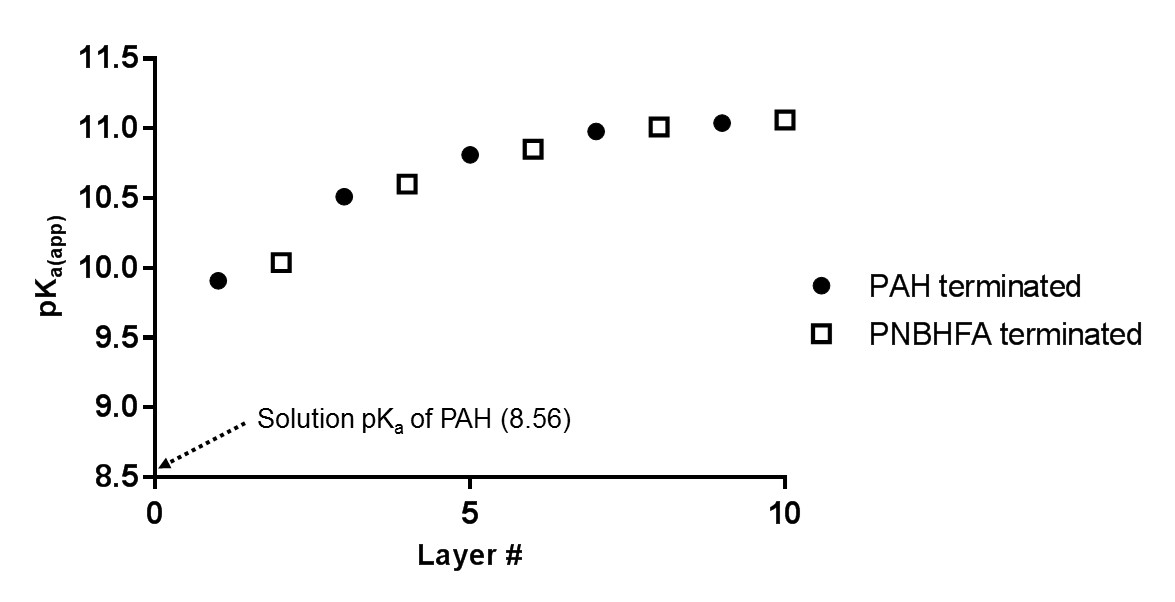
Figure 4: Apparent dissociation constant (pKa(app)) as a relation to total layer number in a PAH/PNBHFA multilayered system assembled at pH = 12.0.
In addition to looking at differing pPE’s for our proton exchange membrane work, we also decided to explore the alternation of the polyanion. To this point we had only looked at PAH. This was due to cost associated with other possible polyanions. We therefore looked at performing post-polymerization modification on PAH. We were able to synthesize a library of amide-linked polyelectrolytes with tethered aliphatic, aromatic, and cubyl moieties. Ultimately, we anticipate structure-property relationships observed in the resulting library of graft-modified polymers can facilitate improved understanding of how to design polyelectrolytes for the construction of well-defined multilayer systems. This work also explored the thermal and spectral analysis of these novel amide tethered polymers from PAH. Therefore, we conducted differential scanning calorimetry (DSC), thermogravimetric analysis (TGA), and solid state nuclear magnetic resonance (SSNMR) spectroscopy on all of the polymer samples. From the SSNMR we were able to confirm coupling (Figure 5). None of the polymers displayed a melt profile, but most possessed multiple endotherms (Figure 6). Clean step-wise decomposition was detected from the TGA work (Figure 7). This work was accepted for publication, and we are further exploring the novel polymers in multilayered systems.
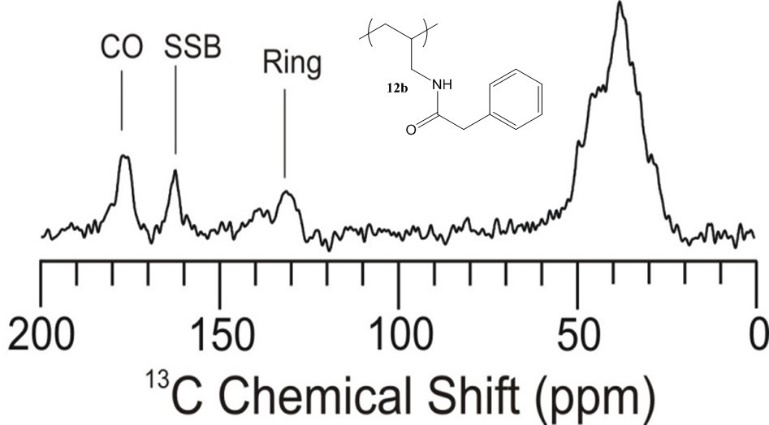
Figure 5. Solid State 13C-NMR of polymer phenylacetic acid - PAH-H.
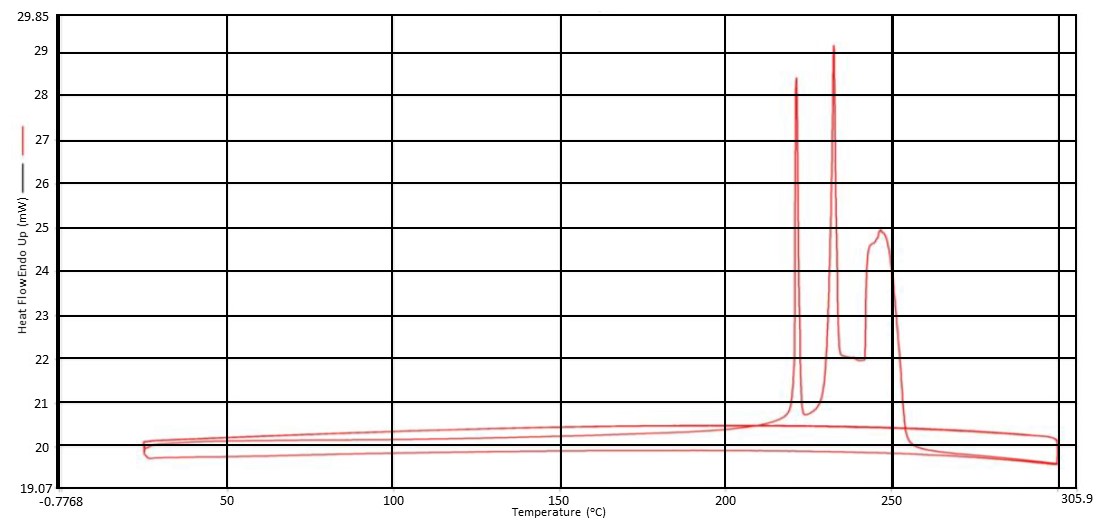
Figure 6. DSC Thermogram of acetic acid - PAH-H polymer.
(a)
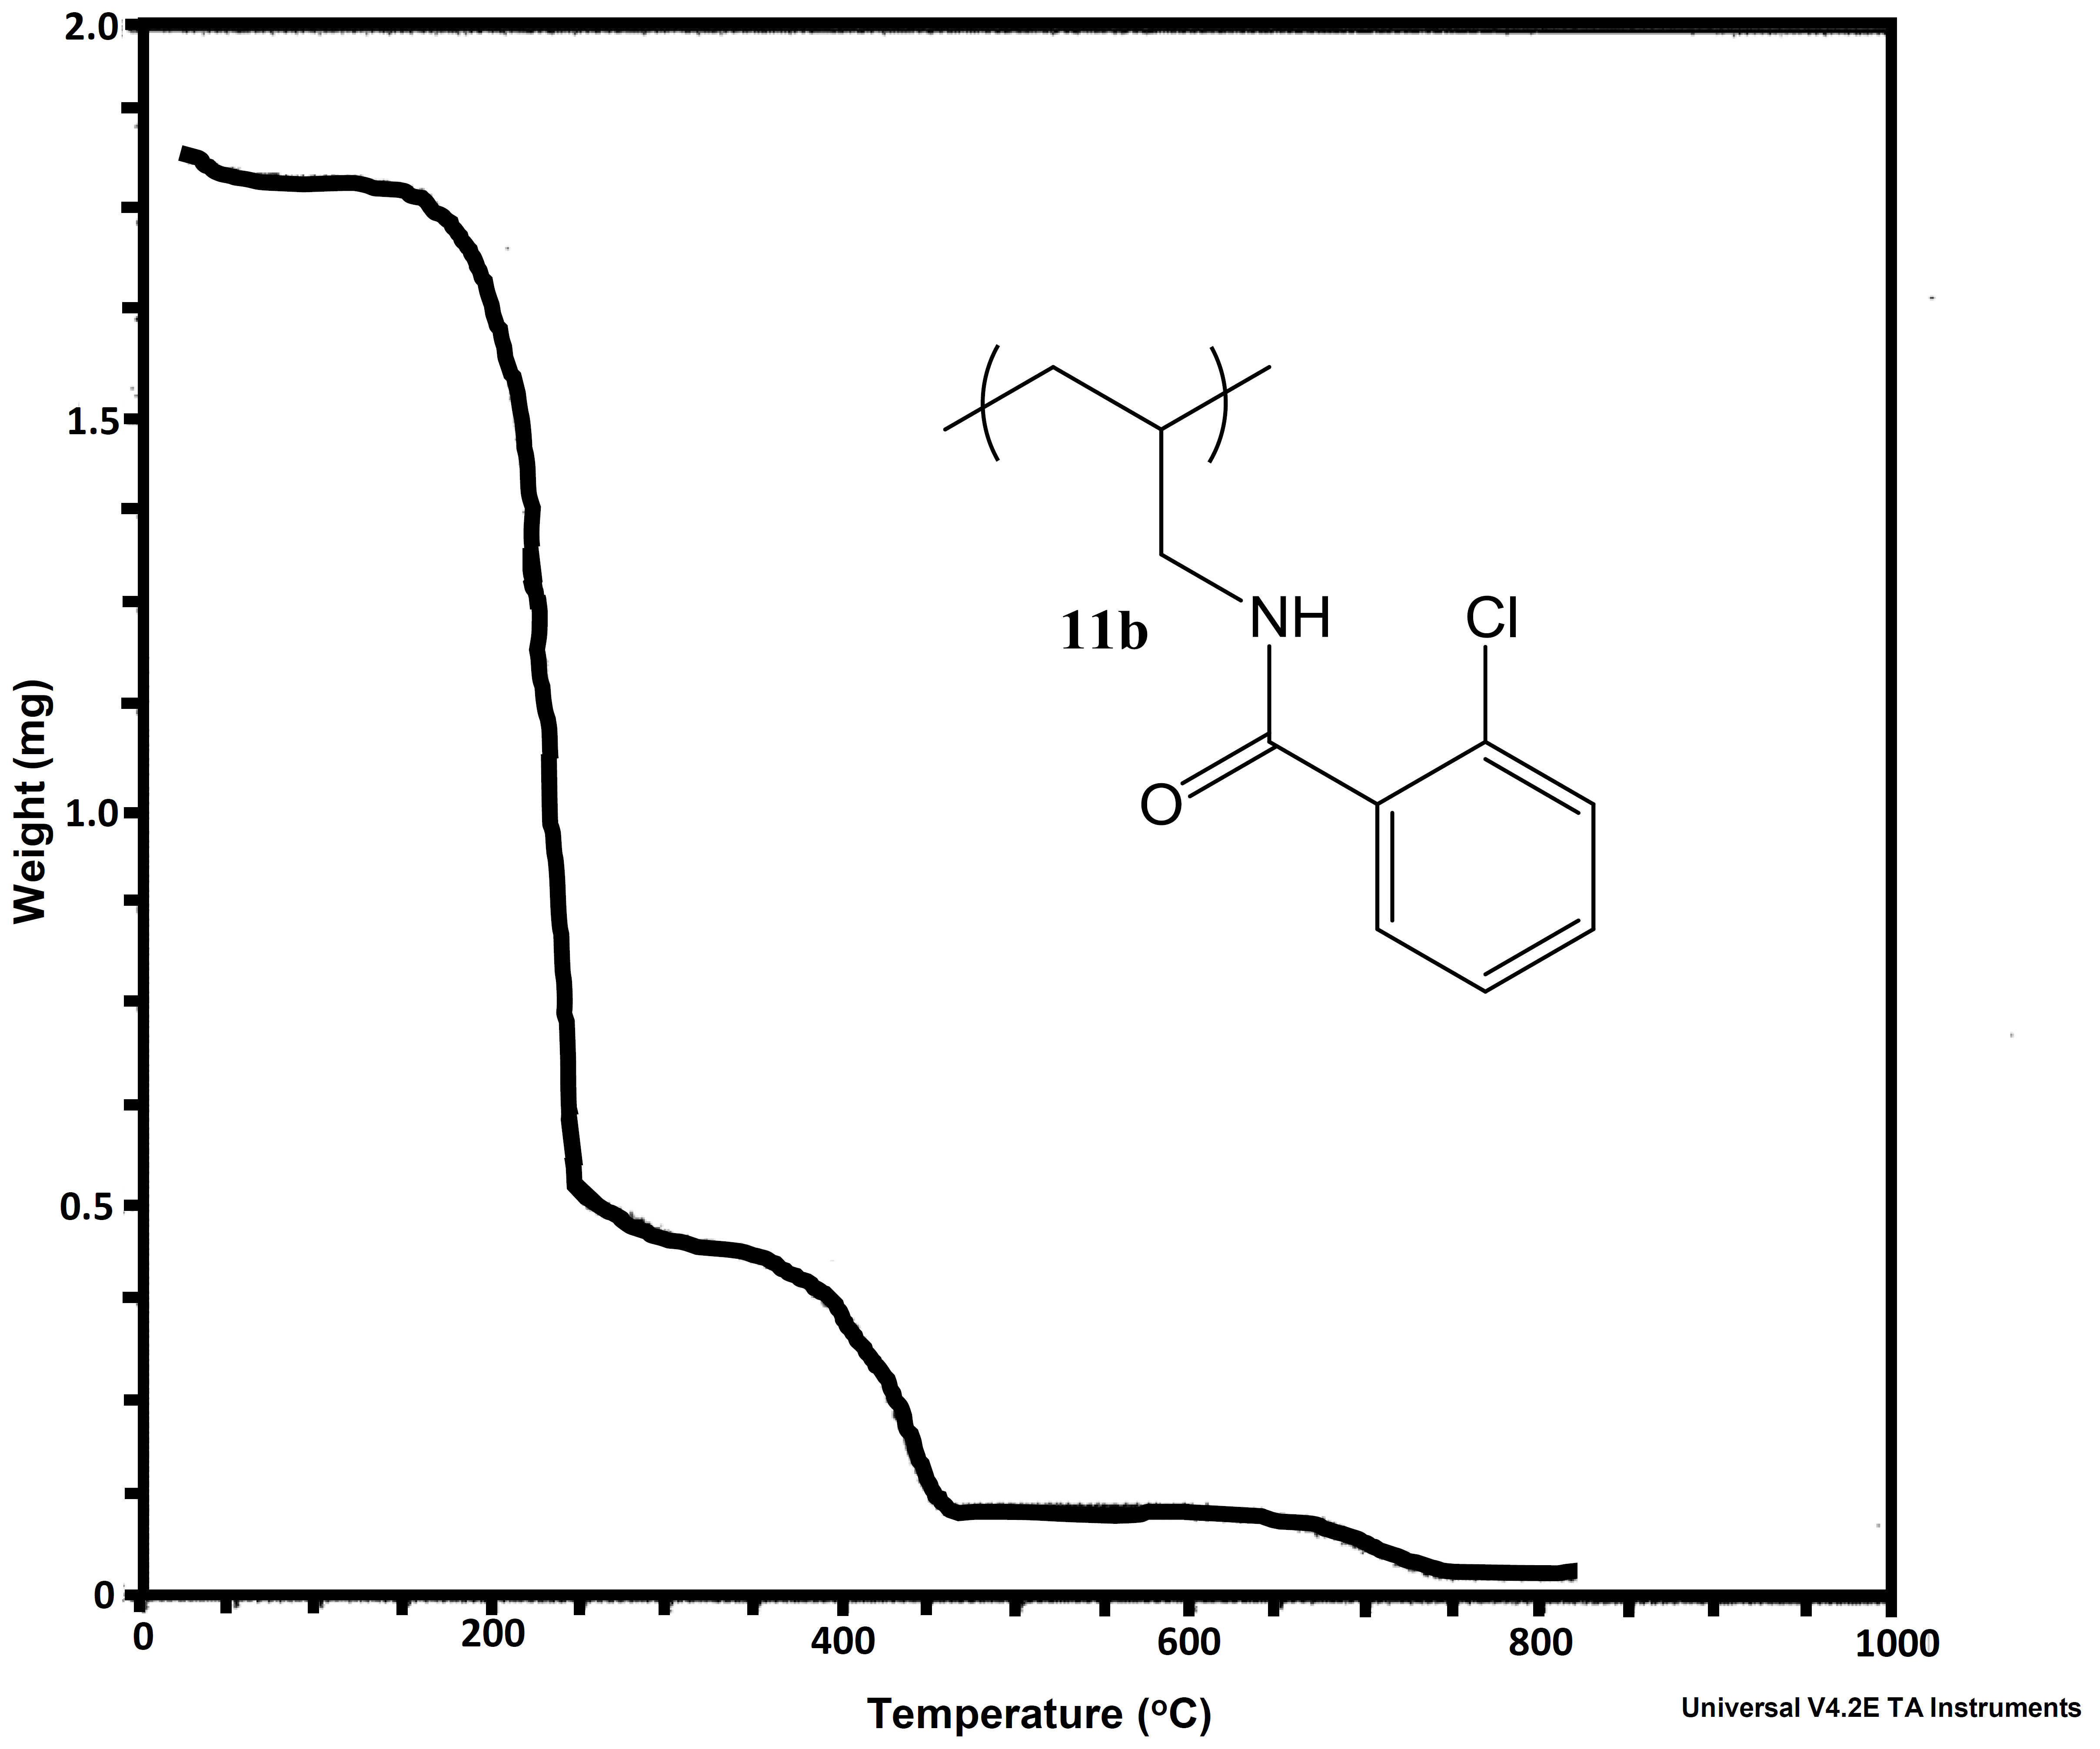
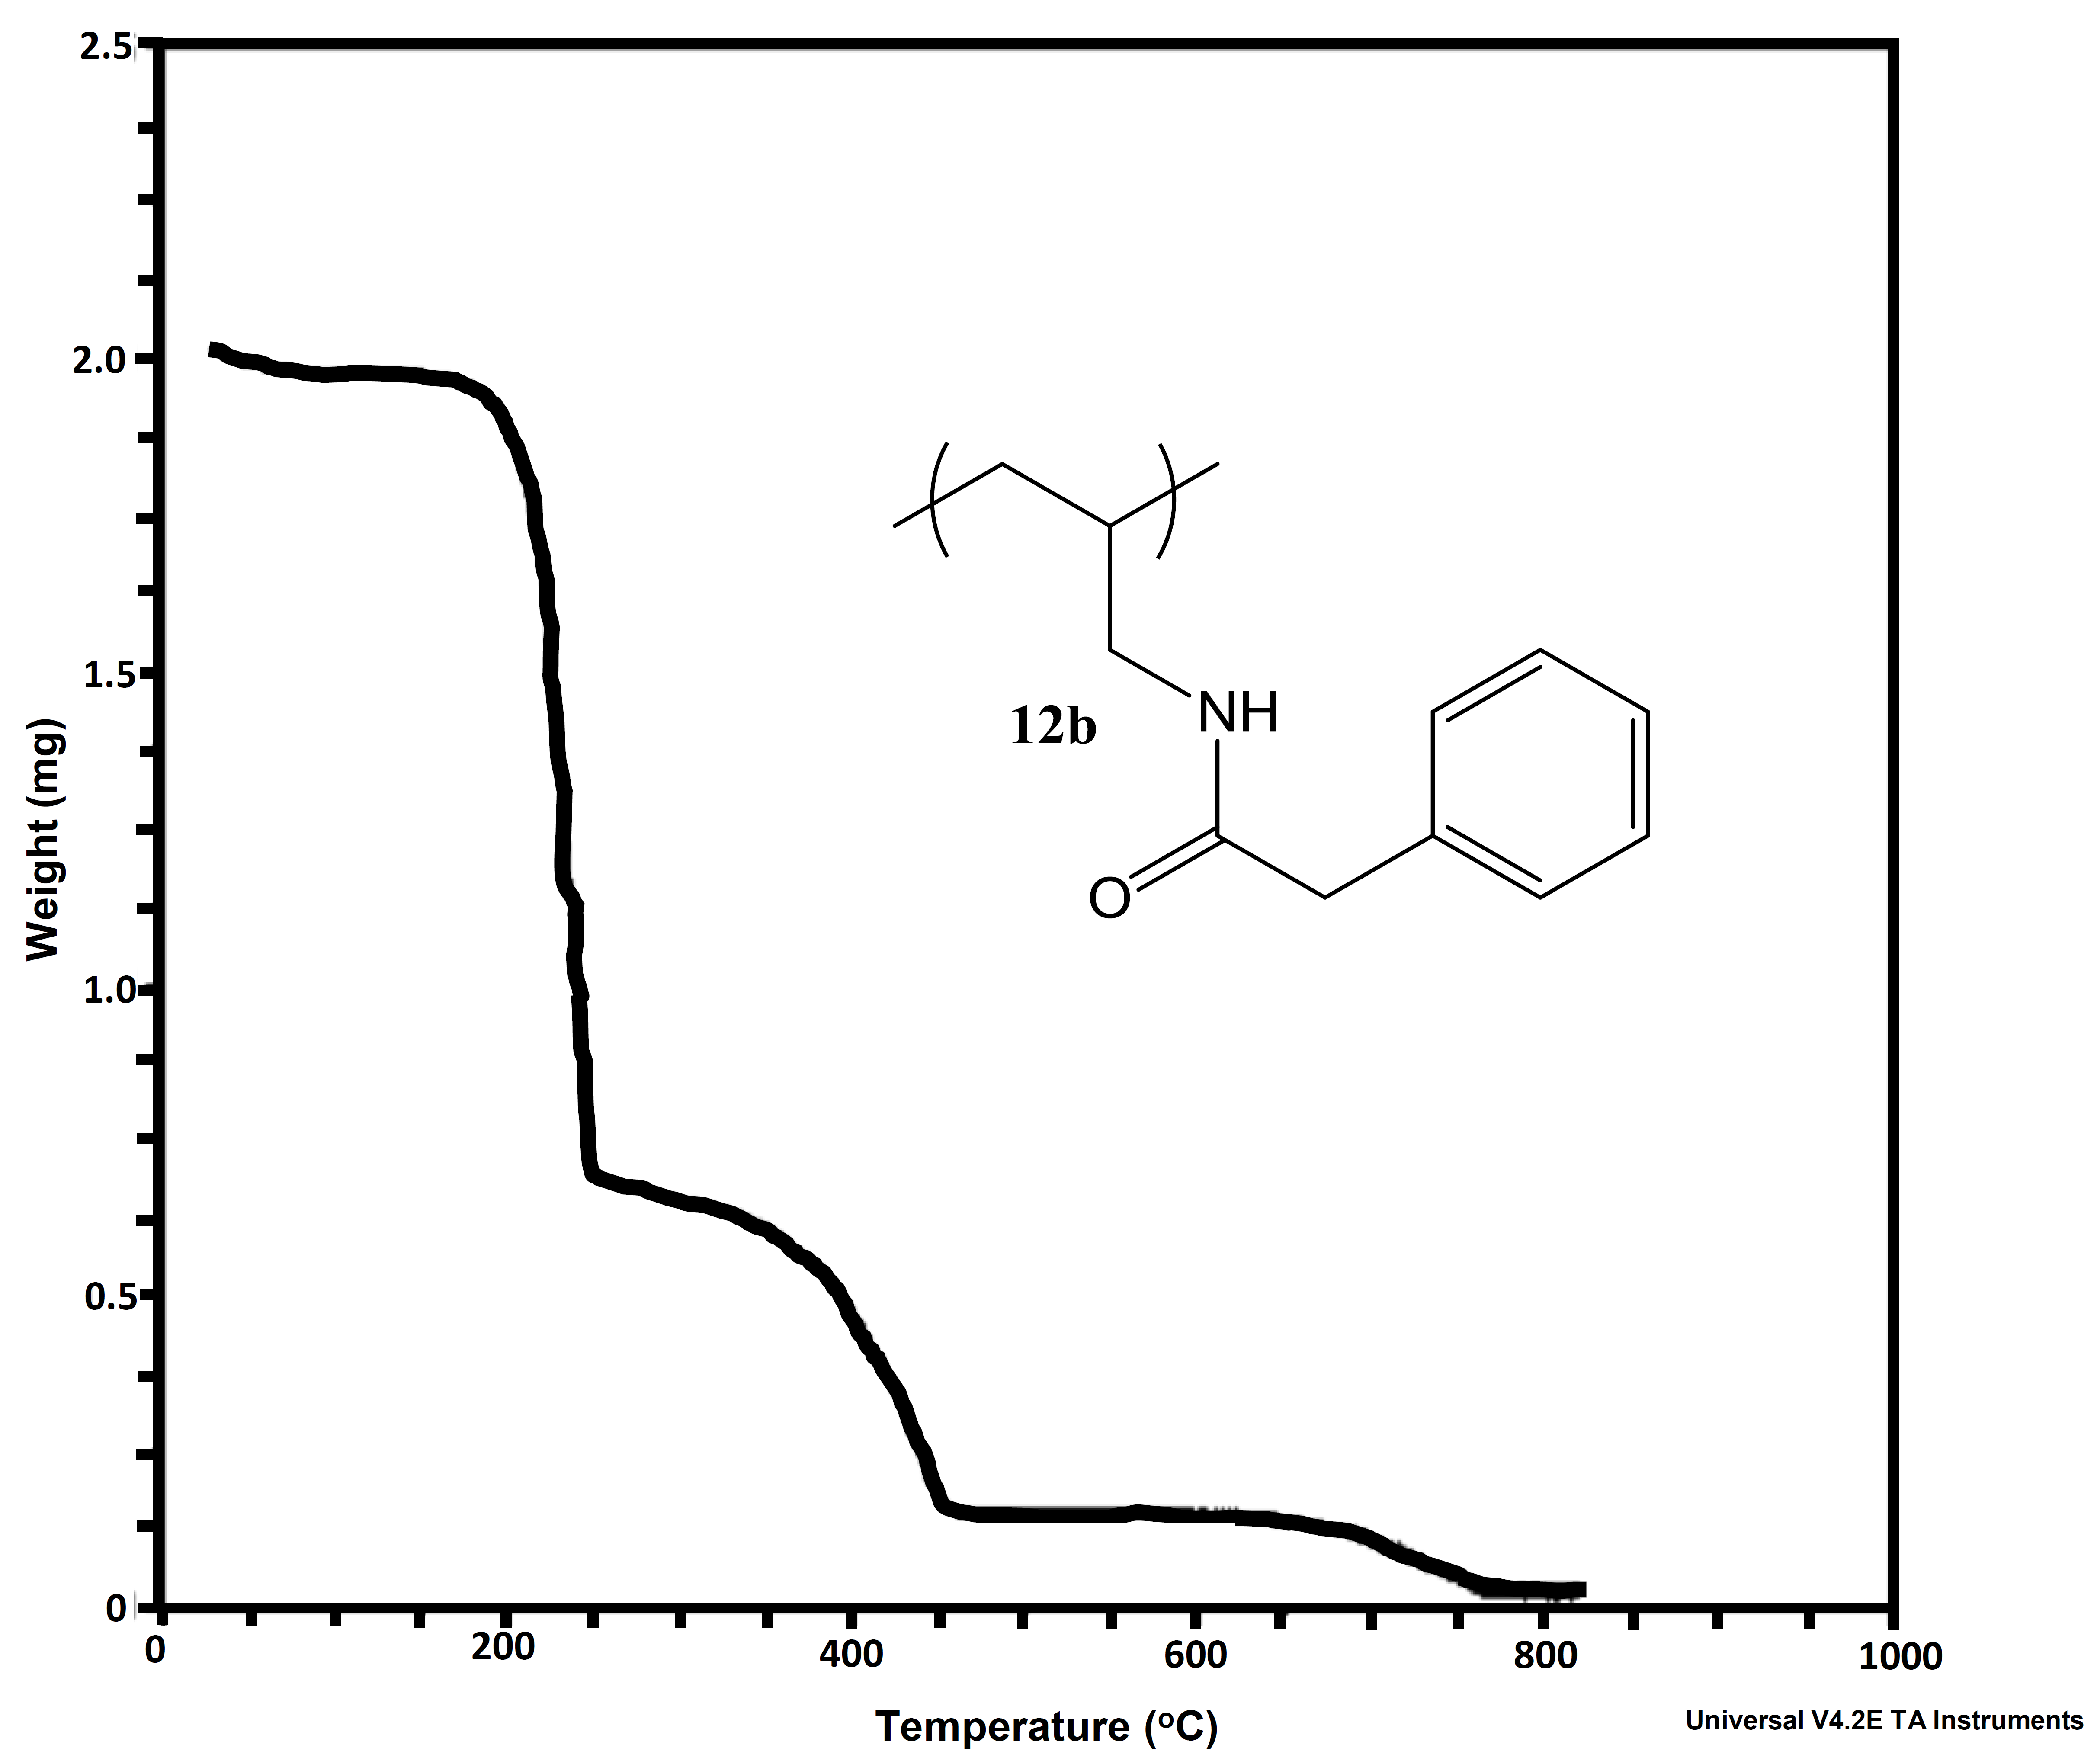
Figure 7a and b: Representative TGA curves for 2-chlorobenozic acid - PAH-H and phenylacetic acid - PAH-H.
One final area of work (which has led to a submitted manuscript) has been on the determination of the pKa values of polymers using surface tension at the surface-to-air interface. Although the determination of pKa values of acids can be done in a multitude of manners, ranging from the classic potentiometric titration to computationally, we envisioned that it would be possible to determine the pKa values of polyelectrolytes using surface tension measurements at the surface-to-air interface. When measuring surface tension at the surface-to-air interface of polyelectrolytes at differing solution pH values a classic sigmoidal curve was obtained with the inflection point being the pKa value of the polymer (Figure 8). The pKa value of PAA, PAH, poly(ethyleneimine) (PEI), poly(sodium 4-styrenesulfonate) (PSS), and poly(methacrylic acid) (PMA) were all obtained with this novel technique. We were also able to illustrate how both the polymer and salt concentration effects the surface tension at the surface-to-air interface and thus the pKa values. This is the first study of using surface tension at the surface-to-air interface to determine pKa values of acids
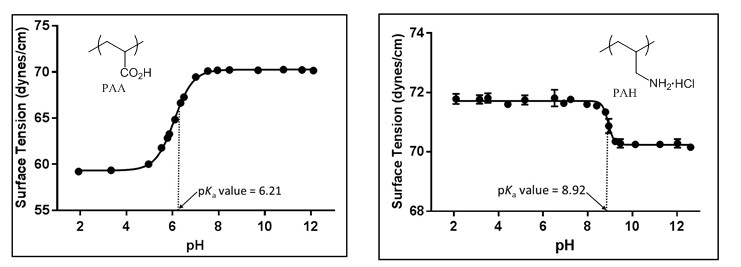
Figure 8: Surface tension of a 0.01M aqueous PAA and PAH solutions at the surface-to-air interface at differing solution pH values.