Reports: UNI1053401-UNI10: Probing Phonons in Low-Dimensional Thermoelectric Materials by Raman Spectroscopy
 printer friendly
In this project we used temperature dependent Raman spectroscopy to study the thermal properties of Bi2Te3 and Bi2Te2S single crystals. The samples were grown using Bridgman technique by our collaborators (Dr. Yong P. Chen’s group) at Purdue University. In our studies we varied the sample stage temperature from 10-300 K. We performed Raman measurements with a commercial Horiba Labram HR Raman microscope system using a 532-nm excitation laser, a 50× long working distance objective lens, a 1800-groove/mm grating, and a thermo-electric cooled charge-coupled device. The Raman setup provides access to frequencies down to 10 cm-1 with spectral resolution of 0.5 cm-1.
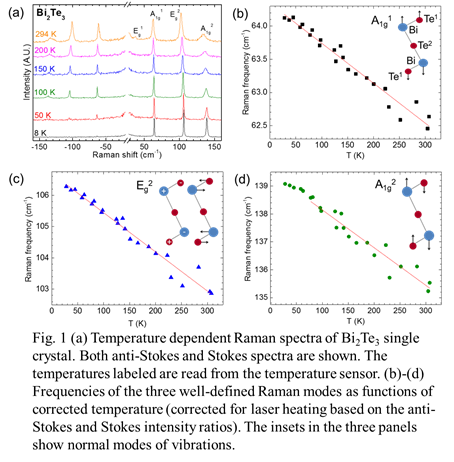
Figure 1(a) displays Raman spectra from Bi2Te3 single crystals at different temperatures read from the temperature sensor. From the anti-Stokes and Stokes Raman intensity ratios, we can estimate the local sample temperature at the laser spot for each spectrum. We used these temperatures corrected for laser heating and plotted the frequencies of the three well-defined phonon lines (A1g1, Eg2, and A1g2) as functions of corrected temperatures, as shown in Figs. 1(b)-(d). We can see that the A1g1 and Eg2 phonon frequencies decrease almost linearly with the increase of temperature in the temperature range we probed (T = 28-300 K). The A1g2 phonon frequency changes linearly with temperature when T >75 K. From these temperature dependent studies of phonons, we can extract temperature coefficients for each phonon mode that is probed by using the equation:
![]() (1)
(1)
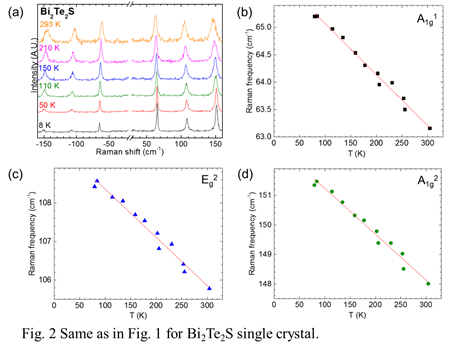
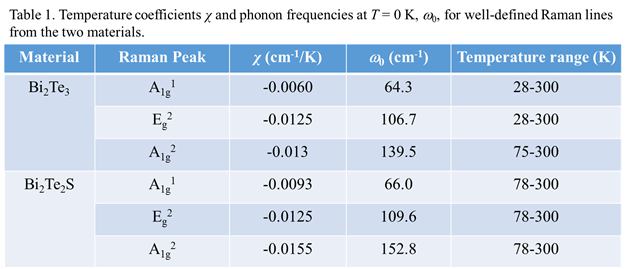
in which χ is the first-order temperature coefficient (slope of the ω-T curve), ω0 is the extrapolated phonon frequency at T = 0 K (intercept of the ω-T curve). The temperature coefficient χ = –0.0125 cm-1/K for the Eg2 phonon in Bi2Te3 in the temperature range that we studied (T = 28-300 K) is close to that reported in the literature (χ = –0.0137 cm-1/K) for T = 223-573 K [Phys. Status Solidi RRL 6, 268 (2012)], indicating that this phonon frequency changes linearly with temperature in a large range of T = 28-573 K. We performed similar temperature dependent Raman measurements and analysis on the spectra from Bi2Te2S single crystals (see Fig. 2). A summary of χ and ω0 for each phonon mode from the two different samples is shown in Table 1.
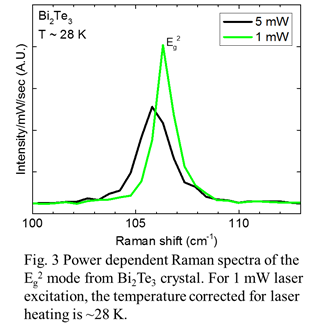
After we obtained the temperature coefficients χ of Raman modes, we estimated the thermal conductivity of Bi2Te3 by conducting power dependent Raman studies. Figure 3 shows Raman spectra taken at local sample temperature (corrected for laser heating) of ~28 K under two different laser power. Thermal conductivity κ can be estimated using the equation
![]() (2)
(2)
in which ![]() is
the change in laser power (corrected for the optical reflectivity), a is
the laser spot diameter, and
is
the change in laser power (corrected for the optical reflectivity), a is
the laser spot diameter, and ![]() .
[Phys. Status Solidi RRL 6, 268 (2012)] From the power dependent measurements
shown in Fig. 3, we estimated that the thermal conductivity κ of Bi2Te3
is ~ 6 Wm-1K-1 at T ~ 28 K. This κ value
is significantly higher than that of Bi2Te3 at room
temperature (1.5-2 Wm-1K-1).
.
[Phys. Status Solidi RRL 6, 268 (2012)] From the power dependent measurements
shown in Fig. 3, we estimated that the thermal conductivity κ of Bi2Te3
is ~ 6 Wm-1K-1 at T ~ 28 K. This κ value
is significantly higher than that of Bi2Te3 at room
temperature (1.5-2 Wm-1K-1).
Our studies show that the absolute values of temperature coefficients for the two out-of-plane Raman vibrational modes (A1g1 and A1g2) from Bi2Te2S are larger than those of Bi2Te3, suggesting that the out-of-plane vibrations of Bi2Te2S are more sensitive to the change of temperature than that of Bi2Te3. This could be related to the reduced c lattice parameter of the Bi2Te2S crystal in which the tellurium atom in the central plane of the quintuple layer is replaced by the sulfur atom. In contrast, temperature coefficients of the Eg2 phonon from the two different crystals are the same, indicating that the in-plane lattice constants of the two crystals may respond in a similar way to the change in temperature. We also estimated the thermal conductivity of Bi2Te3 at T < 30 K using Raman technique for the first time.
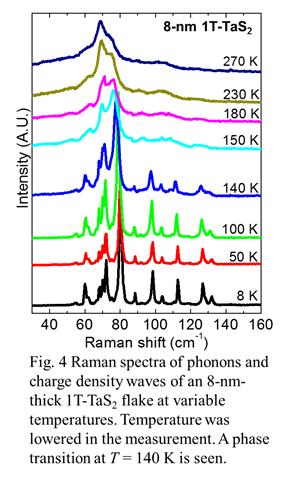
In addition to the studies of thermal properties of doped and undoped Bi2Te3 single crystals, we also conducted temperature dependent Raman measurements of ultrathin 1T-TaS2 flakes (samples were provided by Dr. Abhay Pasupathy’s group at Columbia University). Figure 4 shows preliminary data from an 8-nm-thick flake. A phase transition at T ~ 140 K is seen. We are still analyzing the data to understand the phonon and charge density wave properties of the thin flake of this material.
This PRF grant has allowed the PI to explore a new research area that she has initiated since she started her career as an assistant professor at the University of Northern Iowa (UNI). The research has strengthened collaborations between the PI’s group at UNI, a predominantly undergraduate institution, with groups at large research institutions such as Purdue University and Columbia University. Five papers were published during this PRF grant support period (see publication list). All of these are very important to the PI’s professional development.
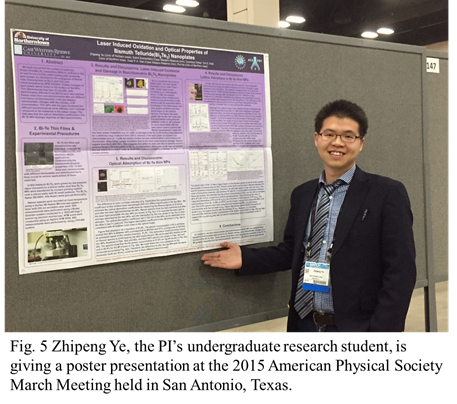
The research projects enabled by this grant provide our undergraduate students with hands-on experience in low temperature optical experiments and expose them to subjects at the forefront of physics research. Nine UNI undergraduates (Casie Means-Shively, Courtney Keiser, Chao Ji, Zhipeng Ye, Heidi Anderson, Jingyi Wen, Chuhan Wang, Xiaoxiao Liu, and Jason Cheng) were supported by the PRF grant and participated in the research activities. Five of them (Zhipeng Ye, Courtney Keiser, Chao Ji, Casie Means-Shively, and Heidi Anderson) are coauthors on three research papers published during this grant active year. Zhipeng Ye attended the 2015 American Physical Society March Meeting held in San Antonio, Texas (see Fig. 5). His trip was supported by this PRF grant. The skills that these students have learned in engaging in the research process will be valuable for their career (graduate school or industry) after graduation.