Reports: DNI553696-DNI5: Dynamics of the dissolution of carbon dioxide (CO2) bubbles in flow and the formation of clay-covered CO2 emulsions
 printer friendly
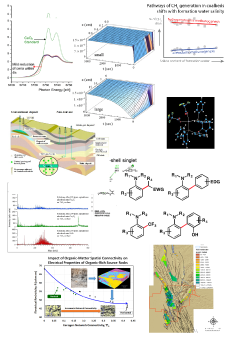
The goal of the proposed research is to understand quantitatively the effect of pressure drop and surface tension on the dissolution of CO2 bubbles and to form stable CO2 bubbles using platelet-like particles such as clay and graphene oxide. The PI has proposed two specific aims (1) identify the effect of pressure drop and surface tension on the formation and stability of CO2 bubbles in a pressure-driven flow; and (2) determine the formation of clay-stabilized CO2 bubbles and their rheological properties to increase our understanding of the dynamics of CO2 bubbles in flow and provide physical principles for construction of effective CO2 foams for CO2 flooding.
Through the support from the ACS PRF award, the PI
and colleagues have demonstrated that the dissolution of CO2
microbubbles in a microfluidic channel experiences two regimes: a rapid
dissolution regime and an equilibrium regime. In the rapid dissolution regime,
spherical CO2 bubbles shrink within 30 ms after generation.
Subsequently, CO2 microbubbles stop shrinking and reach an
equilibrium radius, which varies with the concentration of surfactants, i.e.
sodium dodecyl sulfate (SDS). In particular, for SDS concentrations lower than
the critical micelle concentration (CMC), bubbles shrink more rapidly to reach
a smaller final size as the concentration gets closer to the CMC (Fig. 1a), and
for concentrations higher than CMC, bubbles show the same behavior regardless
of the concentration (Fig. 1b). In a long
microfluidic channel, on the other hand, it has been observed that CO2 microbubbles with initial radii of 15 μm could
maintain their equilibrium sizes for at least 2 seconds (Fig. 1c). We thus
rationalize our observations by considering gases, e.g. air that are already
dissolved in the liquid phase (Fig. 2), and explain the results quantitatively
by applying a modified multicomponent dissolution model. In the model, the rate
of the radius change of a CO2 microbubbles is expressed as 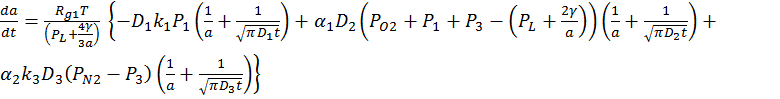 ,
where
,
where ![]() are the gas constant,
temperature and partial pressure of gases. In particular,
are the gas constant,
temperature and partial pressure of gases. In particular, ![]() and
and ![]() are the partial
pressure of O2 and N2 in the atmosphere whereas
are the partial
pressure of O2 and N2 in the atmosphere whereas ![]() and
and ![]() are the partial
pressure of CO2 and N2 in the gas bubble.
are the partial
pressure of CO2 and N2 in the gas bubble. ![]() and
and ![]() . D is the
diffusivity of the gas,
. D is the
diffusivity of the gas, ![]() is the surface
tension,
is the surface
tension, ![]() is the Henry’s law
constant, and
is the Henry’s law
constant, and ![]() is the liquid pressure.
The
subscript 1, 2, and 3 indicate CO2, O2, and
N2, respectively. The model shows a good agreement
with experimental results obtained at high concentrations of SDS (CSDS ≥
CMC), and two-regime features are well explained in terms of the change of
partial gas pressure and liquid pressure (Fig. 3).
is the liquid pressure.
The
subscript 1, 2, and 3 indicate CO2, O2, and
N2, respectively. The model shows a good agreement
with experimental results obtained at high concentrations of SDS (CSDS ≥
CMC), and two-regime features are well explained in terms of the change of
partial gas pressure and liquid pressure (Fig. 3).
Currently, the PI is investigating the effect of surfactants and graphene oxide particles on the stability of CO2 microbubbles. It has been found that the dependence of surfactant concentration on the dissolution of CO2 microbubbles can be reversed when non-ionic surfactants such as octaethylene glycol monododecyl ether (C12E8) are used (Fig. 4A and 4B). Furthermore, when CO2 microbubbles are encapsulated in aqueous drops containing graphene oxide particles, the dissolution of CO2 is significantly reduced and the CO2 microbubbles can be stable for at least 24 hours (Fig. 4C and 4D). The PI now is currently conducting mechanistic investigations of the observed phenomena.
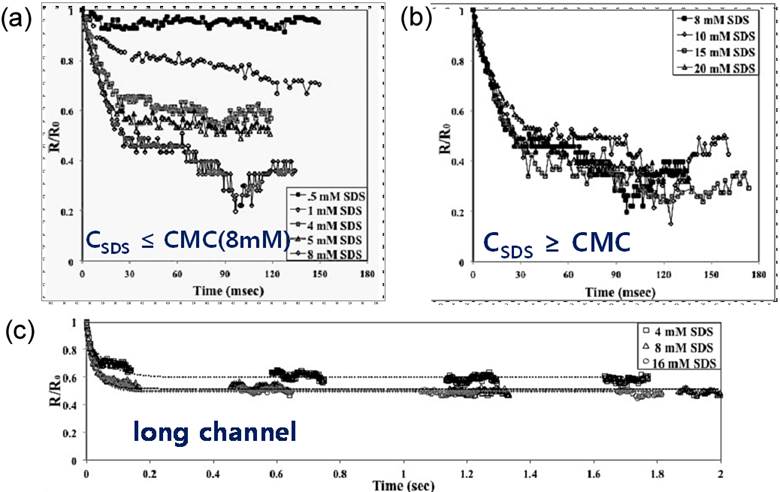
Fig. 1. Change of the nondimensional bubble radius (a/a0) as a function of time at different concentrations of SDS. In the experiments, the bubble radii and the distance of each bubble from the flowfocusing inlet were measured. Time – the x-axis – was obtained by dividing the distance x from the entrance along the channel with the mean flow velocity <v>, i.e. t = x/<v>. (a) The bubble size, reported as a fraction of the original radius, for concentrations of SDS below the CMC. (b) The bubble size, reported as a fraction of the original radius, for concentrations of SDS above the CMC. (c) Experiments in long channels to observe dissolution over longer times. Dotted lines are the fitting curves based on an exponential decay function. The typical initial radius of the bubbles was controlled to be a0 ≈ 15 μm for all experiments.
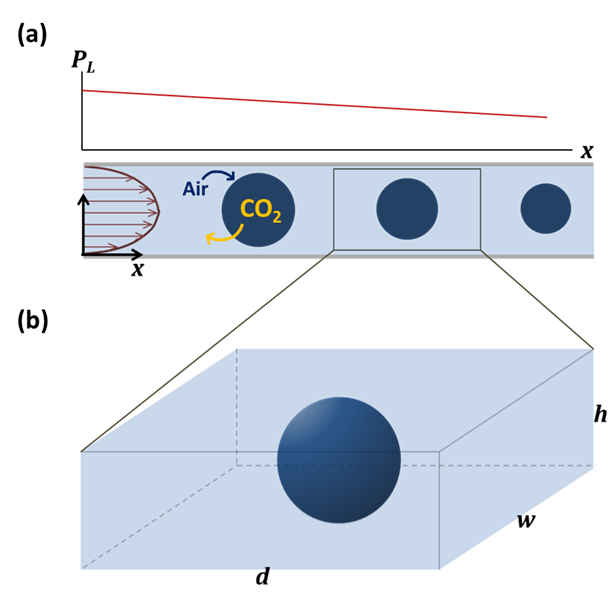
Fig. 2. Schematic of the model CO2 dissolution problem. (a) The bubbles are assumed to move approximately with the same speed as the liquid phase, and so the problem is simplified to (b) an isolated gas bubble dissolving in a static liquid. d, w, and h are the distance between two bubbles, width and height of the channel, respectively. The liquid pressure (pL) around the bubbles linearly decreases along the channel. In the stationary bubble dissolution model, pL is a linear function of time and position, as sketched in (a).
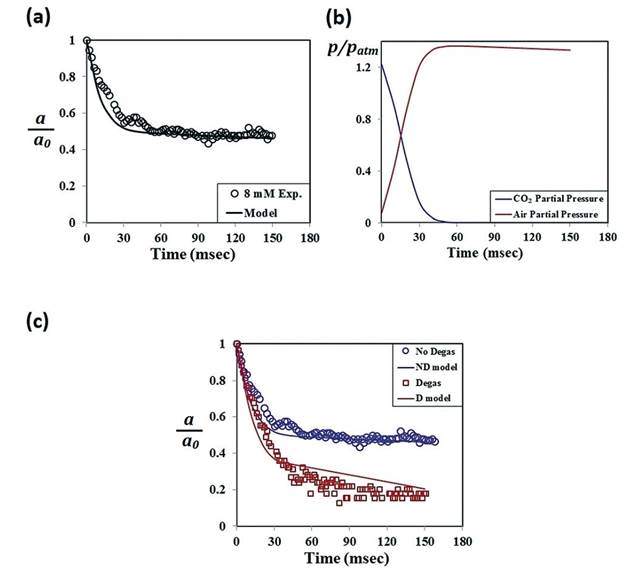
Fig. 3. Test of the multicomponent dissolution model. (a) Change of the nondimensional radius versus dimensional time as calculated from the multicomponent dissolution model and compared with the experiment results in a 8 mM SDS solution. Also, the calculation was done for the initial bubble of 95% CO2. (b) Change of partial pressures of CO2 and air in the bubble plotted versus dimensional time. After 60 ms, the nondimensionalized air partial pressure is in equilibrium with the liquid pressure, which decreases linearly with time. The gas exchange in the bubble leads to an apparent equilibrium behaviour of CO2 gasbubbles in the microfluidic channel. (c) Nondimensionalized radius plotted versus time for the experiments done with 8 mM SDS and degassed 8 mM SDS solutions. Solid lines are obtained from the multicomponent model. For the model calculation of the degassed case, we assumed that the amount of air dissolved in the SDS solution was 1% of the normal case.
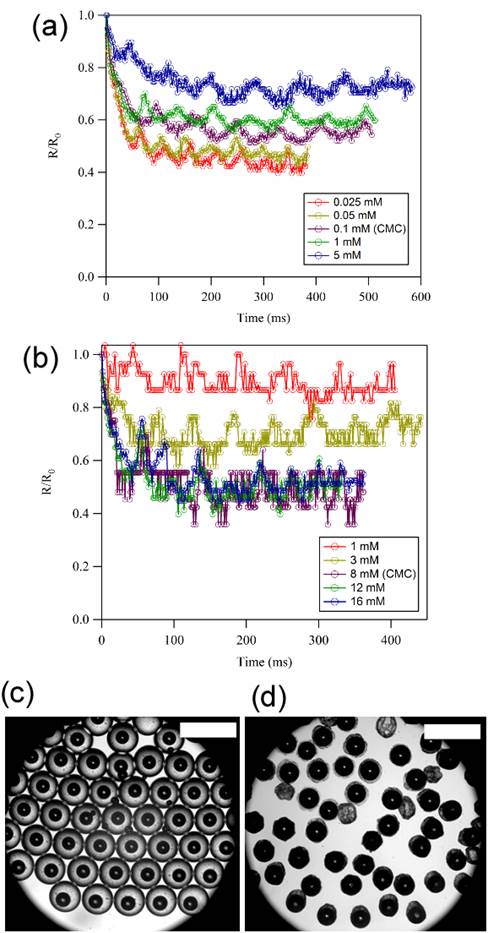
Fig. 4. Effect of surfactant and graphene oxide on the dissolution of CO2 microbubbles. (a) Dissolution of CO2 microbubbles in aqueous phase containing (A) octaethylene glycol monododecyl ether and (b) SDS. CO2 microbubbles encapsulated in aqueous droplets containing graphene oxide particles at (c) t = 0 min and (d) t = 120 min. Scale bar: 700 µm.