Reports: ND1054109-ND10: Nanostructured Surfaces with Wetting Controllability for Dielectric Liquids for Phase Change Heat Transfer
 printer friendly
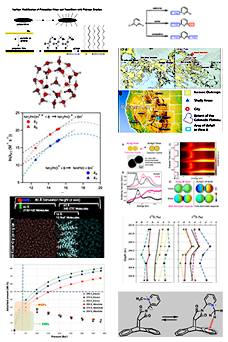
The basic concept of using nanoporous for enhancing evaporative heat transfer is shown in Figure 1. As shown in Fig. 1 (b) and (c), only a small "thin film" region along a vapor-liquid meniscus has efficient evaporative heat dissipation while the thicker liquid layer in the intrinsic meniscus region acts as a large thermal resistance and a very thin region referred to as "absorbed thin film region", comprising of only one to a few monolayers of water molecules, has strong attractive solid-liquid interactions which prevent the liberation of water molecules.
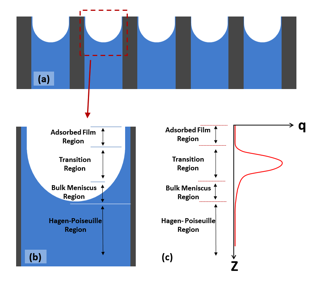
Figure 1. Heat flux inside of nano pores as a function of depth: (a) a schematic of meniscuses inside nano pores (b) an enlarged schematic of a menisci in a nano-channel (c) The heat flux as a function of depth that is also conjoined with the liquid film thickness.
We first modeled the expected thermofluidic performance of the NPM. We took the rarefied gas effect in the nanopores into account. We improved the model by considering the actual profile of an evaporating surface in a nanopore, such as the one showing in Fig. 1(b. The CHF occurs when the capillary pumping pressure is balanced by the fluid flow viscous resistance (in both the nanopores and the microchannels). Fig. 2 shows the modeling result on heating power vs. wall superheat for various fluids. The predicted CHF values for water and IPA are close to 1900 W/cm2 and 200 W/cm2, respectively. These values are unusually high compared to what have been achieved in boiling and evaporative heat transfer, which shows the great potential of using NPM for evaporation.
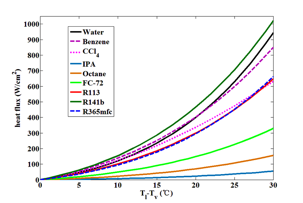
Figure 2. Modeling results for evaporation of fluids through NPMs.
Figure 3 shows our experimental setup. We used AAO as the membranes and IPA as the working fluid. IPA was chosen due to its excellent dielectric properties and high wettability. A thin Pt layer was deposited on top of the AAO membrane to serve as both a heater and a thermometer. The test assembly was placed in a vacuum chamber as shown in Fig. 3(b).
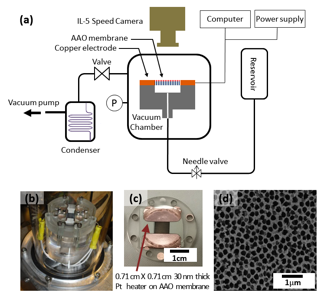
Figure 3. Experimental set up: (a) Overview of set up schematic. (b) Image of the testing apparatus placed in the vacuum chamber. (c) Image of a wick sample. (d) SEM image of the AAO membrane.
Figure 4 depicts the dissipated heat flux as a function of the temperature of the heater. To develop an understanding of the heat transfer mechanism, high-speed images are coordinated with the heat dissipation curve, as shown Fig. 5. Dynamic temperature profiles at different heat fluxes were recorded and shown in Fig. 6. Based on the heat transfer behavior and the visual images, we can divide the heat transfer into three working regimes under different heat flux conditions.
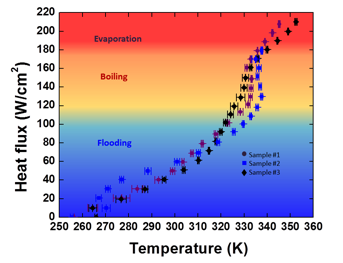
Figure 4. Summarized heat dissipation verses temperature.
At the beginning of the experiment with low heat flux (below 110W/cm2), liquid flooded and formed puddles on top of the membrane as shown in Fig. 5 (a) and (b). The liquid puddles were splashing around until heat flux exceeded 30W/cm2. Temperature of the membrane fluctuated immensely (>5K) in this flooding regime as shown by the blue lines in Fig. 6, especially for heat flux below 30 W/cm2 (fluctuation ~15K).
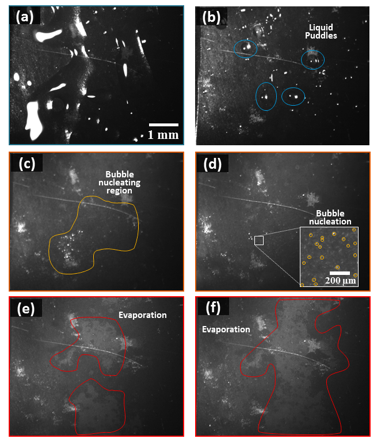
Figure 5. Images of the membrane surface at various heat dissipating regimes: The images are taken at 250 frames per second (FPS) by a high-speed camera. The main mode of heat transfer at each of the images is (a) Flooding, q = 9.7 W/cm2. (b) Flooding, q = 40.6 W/cm2. (c) Micro scale boiling, q = 129.9 W/cm2. (d) Micro scale boiling, q = 151.5 W/cm2. (e) Evaporation, q = 170.1 W/cm2. (f) Evaporation, q = 179.4 W/cm2.
After the heat flux was increased to above ~110W/cm2, flooding was no longer observed and the heat transfer entered into the second regime in which micro-scale boiling and bubble nucleation occurred on top of the membrane as shown in Fig. 5 (c) and (d). In this regime, the membrane temperature remained almost constant which is shown in the dynamic temperature profile (yellow lines in Fig. 6). In this micro-scale boiling regime, when the heat flux was in the range of 110 to 160W/cm-2, the temperature of the membrane reached 330+- 5K.
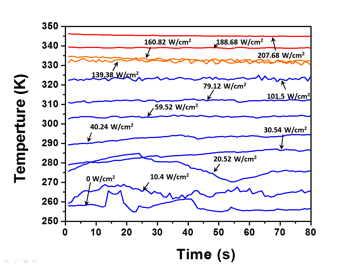
Figure 6. Temperature dynamics at various heating power.
When the heat flux was increased to ~170W/cm2, dried region started to appear as shown in Fig. 5 (e). The temperature profile in Fig. 6 (red lines) shows nearly constant trend. Our best performing sample displayed a temperature fluctuation below 0.5K for an extended period of time. Further increasing of heat flux beyond the 170W/cm2 still did not cause "dry out" in which condition the meniscus liquid-vapor interface recedes to the bottom of the membrane, but the dried region was expended to larger area as shown in Fig. 5(f) and the temperature profile shifted into higher temperature range as shown Fig. 6 (red line). In our experiments, the obtained CHF values ranged from 190 to 210W/cm2 for three AAO membrane samples that have average pore size of 200nm and a ~52% porosity. The temperature of the membrane at dry-out was 355K. The onset of CHF was evidenced by instant burnt out of the sample when the applied power was further increased beyond the CHF.
In summary, we have achieved an enhanced CHF in AAO. The achieved high critical heat flux on the overall AAO surface area was ~ 210W/cm2 which translates to a critical heat flux of ~400W/cm2 if only the pore area is considered, which is much closer to the theoretical maximum heat flux. Therefore, nanoporous membranes could be effectively utilized in high heat flux thermal management devices.