Reports: UNI1054205-UNI10: Methane Adsorption in Dry and Wet Micro-Mesoporous Carbon
 printer friendly
(A) Ultra-high pressure Adsorption of Methane in Micro-mesoporous carbons
All the micro-mesoporous carbons (MicroC1: Micro-C2 and Meso-C1) were synthesized according to the reported method1. For the high pressure measurements a magnetic suspension balance (MSB) from Rubotherm was used.
(B) Results:
The excess and absolute isotherms of methane in pressure as high as 400 bar and temperature of 293 K, 273 K and 253 K are shown in figures 1, 2 and 3, respectively.
The high-pressure adsorption data revealed that adsorption amount increases proportionately with BET surface area (MicroC1: 3379, Micro-C2: 2194, and Meso-C1: 786 m2/g). At near ambient temperature, absolute gravimetric methane uptake was 77, 42 and 8.5 wt.% at 400 bar for MicroC1, MicroC2 and MesoC1, respectively. Nonetheless, the gravimetric uptake was lower than DOE target for natural gas storage (0.5 g/g at 35 bar, near ambient temperature). In order to achieve gravimetric target, at least 120 bar pressure was required for MicroC1; MicroC2 and MesoC1 did not reach this value in our experimental conditions. Despite the fact that they did not reach the DOE target, the gravimetric uptake was higher than all the Covalent-Organic Frameworks (COFs)2-4. Gravimetric methane uptake in these carbon materials are also higher than most of the metal-organic frameworks (MOFs), including MOF-177, HKUST-1 (Cu-BTC), Ni-MOF-74, PCN-14, and UTSA-20. So far, the higher gravimetric methane adsorption of 0.38 and 0.30 g/g at 70 bar were reported for NU-111 and NU-125 respectively5, which were higher than that of MicroC1 at near ambient temperature.
Volumetric methane uptake was an associated parameter for natural gas storage as it dictates the size the tank in the on-board storage system. Figure 4 shows the volumetric methane uptake values that were calculated based on the average bulk/packing density of 0.55 g/cm3. The highest volumetric uptake demonstrated by MicroC1 is 518 v/v (or cm3-STP/cm3) at 400 bar and near ambient temperature (293 K). From the plot, it is clear that MicroC1 reached the new DOE target for volumetric storage capacity (180 v/v at 35 bar). For comparison purposes, we have plotted the volumetric storage amount of bulk methane at ambient temperature. It is clear that the volumetric uptake amount of MicroC1 is always higher than bulk methane indicating benefits of adsorptive storage over bulk method. MicroC2 demonstrated better performance upto 250 bar above which bulk storage appears to be a better choice. MesoC1 demonstrated most poor performance; it is better than the bulk methane only below 50 bar of pressure.
With an aim to compare with other porous adsorbents, we have plotted the regions of volumetric uptake capacity for MOFs and COFs materials at elevated pressure. For MOFs, the reported volumetric capacity lies within the regions of 220 to 260 v/v at ambient temperature and 70 bar pressure2 where, Ni-MOF74 and PCN-14 demonstrated the best performance. Interestingly, the MOF that demonstrated highest gravimetric uptake capacity (NU-111) reflected the minimal volumetric uptake capacity of below 200 v/v (at 70 bar) or 150 v/v (at 35 bar)2 thereby making its uptake lower than DOE target. This opposing trend is probably caused by very low bulk density of this MOF, or any MOF in general. This trend may not be observed for carbon materials, or even, it is possible to compress carbon materials into a more tightly packed monolithic form without significantly losing their property and thereby increasing its packing density and volumetric capacity. For our materials, we assumed the approximate bulk density of 0.55 g/cm3, which is in its powdered form and packed under normal conditions. It has been reported that packing density can be increased to almost three fold upon suitable techniques 6, and if it can be applied to our materials, volumetric capacity could increase several times than the reported value. For MOFs, compression to monolithic form causes serious deterioration of porosity as reported in literature. Although not reported for methane, Zacharia et al.7 demonstrated that despite increase in volumetric hydrogen storage capacity of MOF-177 upon compression, it progressively destroys the crystal structure and porosity and turned into an amorphous material. For Covalent organic frameworks (COFs), the volumetric uptake could not reach the DOE target. Four computer generated (by Grand Canonical Monte Carlo simulations, GCMC) and alkyl substituted COF structures3, including COF-102-Ant, COF-102-Eth-Trans, COF-103-Eth-Trans, and COF-105-Eth-Trans demonstrated enhanced volumetric methane uptake of 114-215 v/v but that are lower than that of MOF materials.
Based on gravimetric high-pressure adsorption, we have calculated heat of adsorption. Unlike low-pressure adsorptions, where it monotonically decreased with the increase in adsorption amount, we found an inflexion point after which the values started in increase (Figure 5). While the decreasing trend can theoretically be supported by surface heterogeneity, the increasing trend can, most likely, be attributed to the greater adsorbate-adsorbate (i.e., methane-methane) interactions compared to adsorbate-adsorbent (i.e., methane-carbon) interactions that started to initiate at a certain adsorption amount or pressure, depending on the characteristics of adsorbent materials. Such opposing trend of heat of adsorption is reported for few MOFs 2, like Ni-MOF-74, HKUST-1, UTSA-20 or PCN-14 and COFs 5, like COF-102, 103 and 8.
In order to find the correlation of activation energy (E) obtained pseudosecond order kinetics (figure 6(a, b)) with BET surface area, we have shown the plot in figure 6(c). In low-pressure regime, we have found that activation energy varies exactly linearly with BET SSA (with regression coefficient =1) by an equation
E=0.0035X(BET) + 25.797. However, in high pressure regime, we did not reveal any linear relation, as observe in the figure.
[1]Energy Technology, accepted (doi: 10.1002/ente.201600172)
[2]J. Am. Chem. Soc. 2009, 131 , 8875-8883.
[3]J. Phys. Chem. A, 2011, 115, 13852-13857.
[4]J Phys Chem. A, 2010, 114, 10824-10833.
[5]J. Am. Chem. Soc, 2013, 135, 11887-11894.
[6] Scientific Reports, 2013, 17, 2975.
[7]J. Mater. Chem. 2010, 20, 2145-2151.
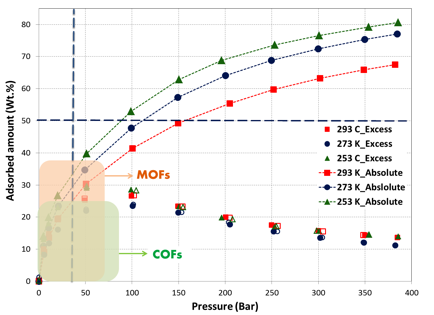
Figure 1
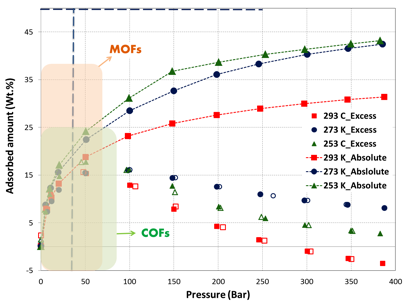
Figure 2
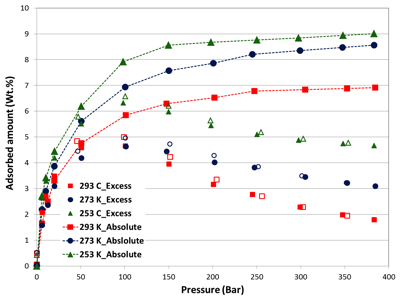
Figure 3
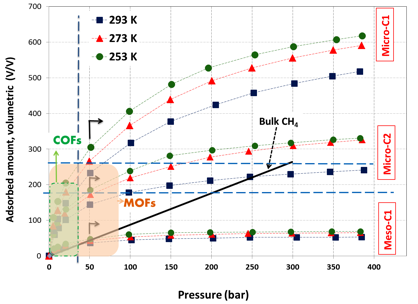
Figure 4
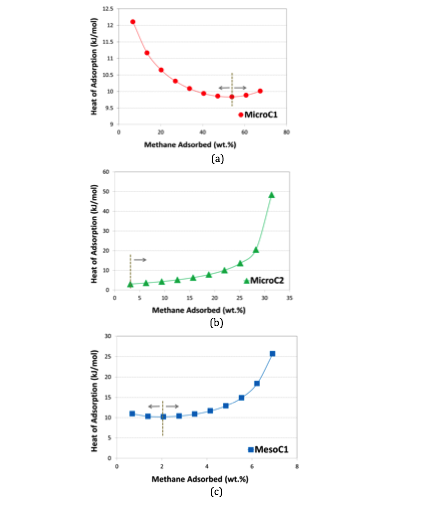
Figure 5
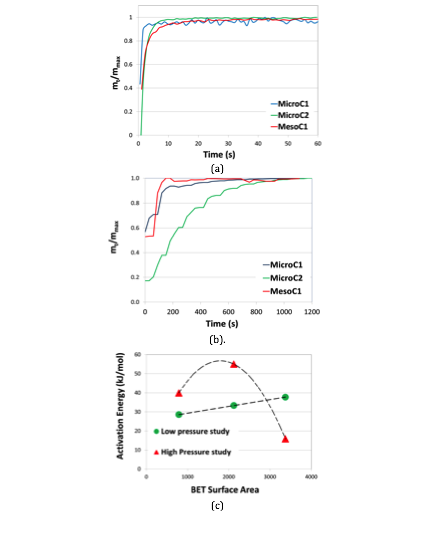
Figure 6