Reports: DNI955591-DNI9: Investigating the Role of Wettability in Enhancing Shale Gas Production
 printer friendly
Water loss in low permeability reservoirs during hydraulic fracturing typically results in a decrease in natural gas production due to capillary trapping near the fracture face. However, industry experience has demonstrated an opposite trend where greater water loss is associated with improved gas production. This project seeks to gain a better understanding of the role that surface-active chemicals used during hydraulic fracturing completions have in controlling water loss in shale gas reservoirs.
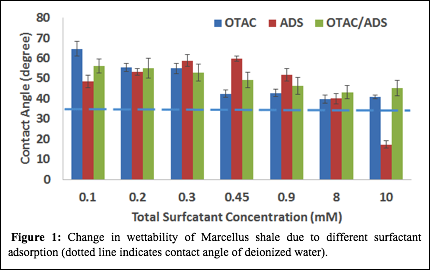
The first phase of this work examined alteration of shale wettability caused by contact with mixed charge surfactants solutions. Contact angle and surface tension measurements were collected for two different shale rocks, the Marcellus (PA) and the Collingwood (MI). Cationic n-octadecyltrimethyl ammonium chloride (OTAC) and anionic ammonium dodecyl sulfate (ADS) surfactants were chosen for this wettability study. These two surfactants are commonly used in hydraulic fracturing fluids and their mixing behavior was well described in the literature. Both pure surfactant solutions and 1:1 mixtures at concentrations above and below the critical micelle concentration (cmc) were studied. Figure 1 shows the comparison of contact angle measured for ADS, OTAC and 1:1 ADS/OTAC surfactant solutions on polished Marcellus shale. Measured contact angles on the Marcellus sample for all surfactant solutions were above the pure water (dotted line) contact angle (at least up to 0.9 mM), which indicates a change in shale wettability due to surfactant adsorption.
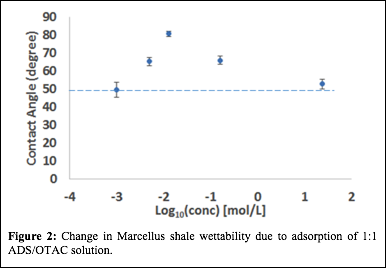
The shale surface was altered from highly water-wet to moderately water-wet. An additional set of experiments was performed on a second Marcellus sample to better understand the synergistic effect of the mixed surfactants in altering surface wettability at lower concentrations (Figure 2). As shown in Figure 2, the 1:1 ADS/OTAC mixture initially increases the contact angle up to a total surfactant concentration of 0.15 mM and then serves to decrease the contact angle as surfactant concentrations are increased beyond 0.15 mM. At 0.15 mM concentration of the 1:1 ADS/OTAC solution, the surfactant solution demonstrated an enhanced ability to tune the shale wettability from a less water wet (~50°) state toward a weakly water wet (~80°) state compared to equimolar concentrations of either individual surfactant.
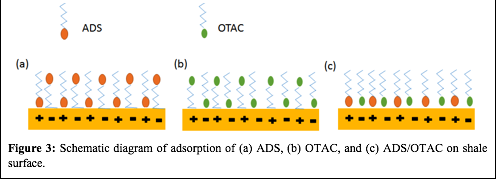
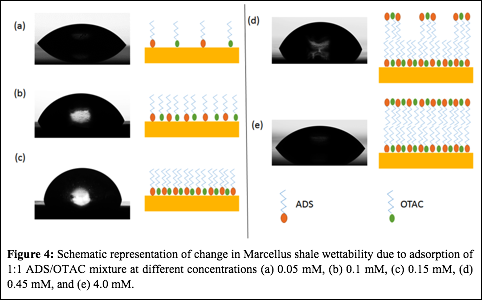
The demonstrated synergy of the mixed cationic/anionic surfactant mixtures in altering shale wettability at low surfactant concentration, suggests that an adsorption mechanism such as that shown in Figure 3 is taking place. Charged surfactants, like ADS and OTAC, can be adsorbed on the surface either by strong headgroup-surface electrostatic interactions or by weak tail-surface hydrogen bonding interactions. The coexistence of both positive and negatively charged surfaces in shale rocks is due to the heterogeneous mineralogy of the rock (e.g., quartz(-) and calcite(+)). In the ADS/OTAC 1:1 mixture both of the charged surfactant headgroups can find oppositely charged positions on the rock surface, as is depicted in Fig. 3(c). This mixed surfactant adsorption increases surfactant adsorption density at lower total surfactant concentrations and faster surface coverage compared to the pure ADS and OTAC solutions. Minimal tail-surface interactions would be expected due to the preferential headgroup-surface interactions being the dominant surfactant sorption mechanism. This means that most of the tails would be oriented upwards for low total surfactant concentrations of the ADS/OTAC mixture, which supports the hypothesis that larger contact angles would be measured at lower surfactant concentrations for the mixed surfactant solution compared to pure ADS or OTAC solutions. Development of a surfactant bilayer eventually causes a decrease in the contact angle as the second layer of sorbed surfactants face outward with their charged headgroups (Figure 4).
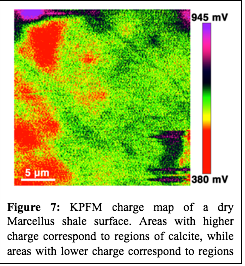
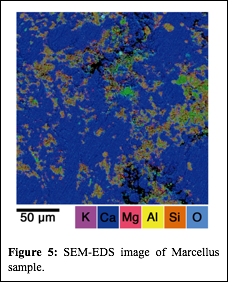
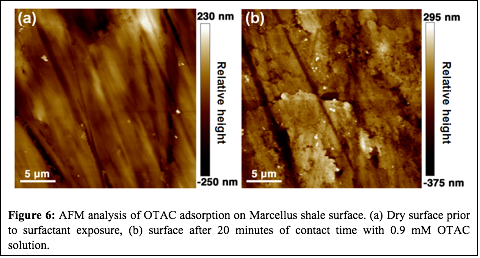
Although the contact angle measurements are helpful in understanding how surfactant mixtures may alter shale wettability, the microscopic change in shale wettability may depend on the mineral distribution on a shale surface or within a pore. Figure 5 shows an SEM-EDS image of a Marcellus sample, clearly demonstrating the high degree of mineral heterogeneity at sub-micron scales. Atomic force microscopy (AFM) was used to understand the surfactant adsorption behavior at submicron scales and to further validate the proposed surfactant adsorption mechanism. Figure 6 shows an AFM image of a polished Marcellus shale surface before and after exposure to a 0.9 mM OTAC solution. The non-uniform surfactant adsorption on the shale surface is evident by comparing the relative height profile of the shale surface before and after surfactant exposure, suggesting that OTAC may be preferentially adsorbing on the negatively charged minerals. To correlate the mineral distribution with the specific surfactant adsorption mechanism, kelvin probe force microscopy is being used to investigate the surface potential of the shale prior to exposure to surfactant solutions. The color variation of the surface potential map shown in Figure 7 indicates the mineral distribution at sub-micron scale. Future work will try to coordinate the surface potential mapping and surfactant adsorption study in series at the same exact location to directly correlate the different surfactant adsorption mechanism with the shale mineral distribution. This work will build the foundation for the second phase of this project that will explore how shale mineralogy and surfactant additives may control the extent and location (i.e., large vs. small pores) of water imbibition in shale gas reservoirs.
Figures
| Figure 1: Change in wettability of Marcellus shale due to different surfactant adsorption (dotted line indicates contact angle of deionized water).
|
| Figure 2: Change in Marcellus shale wettability due to adsorption of 1:1 ADS/OTAC solution.
|
| Figure 3: Schematic diagram of adsorption of (a) ADS, (b) OTAC, and (c) ADS/OTAC on shale surface.
|
| Figure 4: Schematic representation of change in Marcellus shale wettability due to adsorption of 1:1 ADS/OTAC mixture at different concentrations (a) 0.05 mM, (b) 0.1 mM, (c) 0.15 mM, (d) 0.45 mM, and (e) 4.0 mM.
|
| Figure 5: SEM-EDS image of Marcellus sample.
|
| Figure 6: AFM analysis of OTAC adsorption on Marcellus shale surface. (a) Dry surface prior to surfactant exposure, (b) surface after 20 minutes of contact time with 0.9 mM OTAC solution.
|
| Figure 7: KPFM charge map of a dry Marcellus shale surface. Areas with higher charge correspond to regions of calcite, while areas with lower charge correspond to regions of clay and/or quartz.
|