Reports: ND753739-ND7: Nanostructured and Nanoporous Composites from Nanoparticle Jamming during Polymerization Induced Phase Separation
Bryan D. Vogt, University of Akron
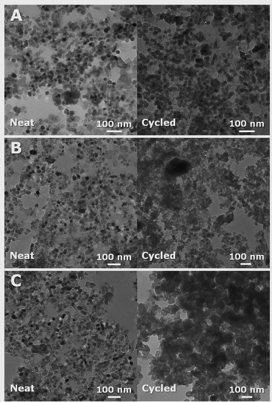
The primary objective associated with this project is to use nanoparticles during polymerization induced phase separation to control and modify the morphology to improve the properties of the nanocomposite blends. The initial system used poly(hydroxyethylmethacrylate), titania nanoparticles, and furfuryl alcohol. A photoacid was used to catalyze the polymerization of the furfuryl alcohol. This system has the advantage that the morphology can be readily assessed after carbonization as the methacylate is removed and the poly(furfuryl alcohol) becomes carbon. Unfortunately, the morphology is not significantly impacted by composition as shown in Figure 1.
Figure 1. TEM images of carbonized poly(hydroxyethylmethacrylate), titania nanoparticles, and poly(furfuryl alcohol) as a function of the molecular weight of the PHEMA (A) 20K, (B) 300K, and (C) 1000K
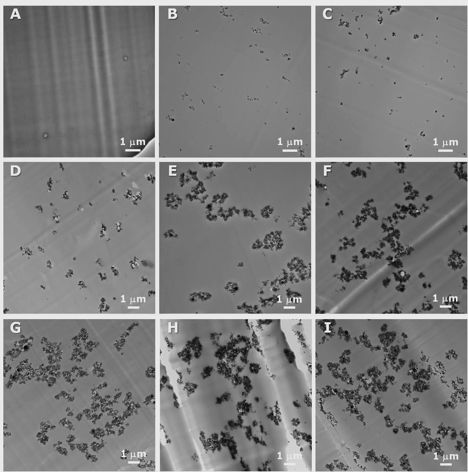
Next we examined a more similar system of poly(methyl methacrylate), alumina nanoparticles, and ethyl acrylate. Through the range of compositions examined, the mechanical properties do not vary more than can be obtained with standard processing of nanocomposites. When examining the morphology of these nanocomposites, individual domains are formed and not the desired bicontinuous morpholology (Figure 2).
Figure 2. TEM images of 1.5 g PEA/0.5 g PMMA/Al2O3 composites fabricated using Al2O3 nanoparticles (A) 0, (B) 0.75, (C) 1.65, (D) 4.87, (E) 8.35, (F) 9.92, (G) 10.03, (H) 12.27, and (I) 15.32 wt%.
We decided to change to 2D materials in a solvated polymer in order to try to better modulate the structure of the composite. We selected a hydrogel system of branched poly(ethylenimine) (BPEI), graphene oxide (GO), and poly(acrylic acid) in water. Interestingly, the mixing of the BPEI and GO leads to a separate aqueous phase. As phase separation occurs, we initially focused on characterizing the properties of these aqueous mixtures of BPEI and GO.
Fig. 3 schematically illustrates how the GO and BPEI mixture forms a network structure of the hydrogel. BPEI was dissolved in Milli-Q water (0.010 wt% ² [BPEI] ² 4.0 wt%) and stirred overnight. The pH was adjusted to 8.05 using dilute HCl. The GO/BPEI hydrogels were prepared by mixing 12 mL of the aqueous suspension of GO (1 mg/mL) and 4 mL of the aqueous BPEI solution. The mixture was sonicated for 2 min, allowed to rest for 20 min, and then the hydrogel was collected by centrifugation (6000 rpm, 15 min). As the hydrogels were fabricated by mixing an aqueous suspension of GO and a BPEI solution, the supernatant associated with this fabrication process contains some residual GO and BPEI, so it is important to quantify the composition of these hydrogels. The solid composition of the GO/BPEI hydrogels was estimated from TGA measurement. The BPEI:GO (m:m) ratio (R) of the dried GO/BPEI hydrogels can be varied from predominately polymer to predominately GO in terms of the solids content.
Figure 3. Schematic illustrating the 3D network in GO/BPEI hydrogels that is formed by electrostatic interactions (red dashed circles) and hydrogen bonding between the GO and BPEI.
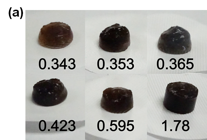
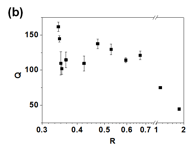
The compositions of the GO/BPEI hydrogels impacts their physical appearances as shown in Fig. 4a, where the color of the hydrogels ranges from brown to black, possibly due to the reduction of GO by the amine groups in BPEI. Unexpectedly, as the BPEI concentration increases (larger R), the hydrogels progressively darken from amber to brown to black. In addition to color, the composition of the hydrogel impacts its equilibrium hydration as quantified by the swelling ratio, Q, which is defined as (mass of fully swollen hydrogel)/(mass of dried hydrogel). As R increases (more BPEI), Q tends to decrease as shown in Fig. 4b. For R < 0.669, the swelling ratio fluctuates between 102 and 162, which corresponds to hydrogels containing more than 99.0% water. When the mass of BPEI exceeds that of the GO (R > 1), there is a precipitous decrease in Q.
Figure 4 (a) Images of the native hydrogels after fabrication by solution assembly as a function of the BPEI concentration. (b) Equilibrium swelling ratios (Q = mass of hydrogel/mass of dried hydrogel) of the native GO/BPEI hydrogels.
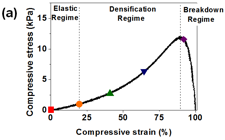
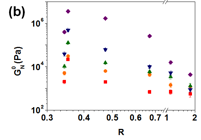
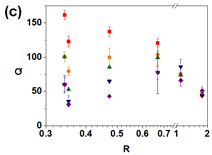
Compressive behaviour of the GO/BPEI hydrogels was examined in order to investigate their mechanical properties under compressive strain. The compressive stress-strain curves of the GO/BPEI hydrogels with R = 0.473, Fig. 5a, can be divided into three regimes. These are first the elastic regime at low strain (_ < 20-30%) where the stress increases linearly with the strain, secondly the densification regime, where the stress increases rapidly with the strain due to the increasing contacts between the GO sheets, and finally the breakdown regime, where the stress decreases with the strain due to the collapse of the GO/BPEI network. The three regimes in the compressive stress-strain curves can be identified for all hydrogels with R < 1.10. With increasing compressive strains, Fig. 6b, the GO/BPEI hydrogels show a stiffening in response to the mechanical load, wherein the plateau modulus increases by 1-3 orders of magnitude. The relation between plateau modulus vs R remains non-monotonic under compression, and the highest plateau modulus obtained from compression of a gel was ~3.62 MPa. Note that hydrogels with higher R value lost less water during compression (Figure 6c). The stiffening and deswelling by compression was irreversible even when the hydrogels were re-immersed in water. A potential contributing factor to the stiffening is an increase in the crosslink density of the hydrogels due to more contacts between BPEI and the GO sheets that form during compression, as suggested by the irreversible deswelling and the decrease in tan δ, Fig. 6d.
Fig. 6 (a) A typical compression curve of GO/BPEI hydrogel with R = 0.473. Three regimes were identified: the elastic regime, the densification regime and the breakdown regimeR dependence of the (b) plateau modulus and (c) swelling ratio of the GO/BPEI hydrogels with different compressive strains. (d) The R dependence of the tanδ of GO/BPEI hydrogels at tanδ = 100 rad/s with different compressive strains. For all the figures, the symbols for different compressive strains are ◆ (0%), ▲ (20%), ▼ (40%), ● (64%) and ◼ (90%).

