Reports: DNI753243-DNI7: Identifying Molecular Structures of Polymers with Asymptotic Nonlinear Shear Rheology
 printer friendly
Executive summary
The objective of this grant is to identify molecular features from macroscopic rheology. Our approach is to infer this information by fitting constitutive model parameters to rheological data.
We specifically use medium-amplitude oscillatory shear (MAOS)1 data which is asymptotically-nonlinear and yields, in addition to the two well-known linear material functions (G' and G"), four new nonlinear material functions. During the first year of the grant, we established that more modes are needed to fit nonlinearities than linear data in contrast to the common approach of using the same number of modes for both linear and nonlinear data. During the second year, we established that an honest quantification of uncertainty for physically meaningful fit parameters requires fitting the linear and nonlinear data of MAOS simultaneously in contrast to the established practice of fitting linear and nonlinear data separately.
The third year largely focused on linear data for identifying the best: (1) material function representation and, (2) weighting of residuals for least-squares fitting, with the final aim of reducing uncertainty in fit parameter estimate due to these subjective choices. We have identified based on a theoretical statistics reasoning that the best representation for a strain-controlled test is the moduli representation: G' and G" while the compliance representation (J' and J") is the best for stress-controlled protocol. We further observe that the best weighting of residuals is with the repeat measurement uncertainty of the data. In fact, weighting with repeat measurement uncertainty is the more dominant factor in reducing uncertainty due to subjectivity. Currently, we are putting together a manuscript for journal publication on this work.
In addition, the PI collaborated with a colleague to develop a Bayesian inference technique for rheological model selection, which has already been published2. Currently, we are further exploring the Bayesian framework for quantifying the uncertainty of highly non-Gaussian fit parameters observed in over-parameterized systems. Another ongoing effort is the exploration of numerically cheap and faster techniques like Bayesian inference criteria (BIC) for model selection.
Details on Progress
For a material under sinusoidal strain input signal, the time dependent stress response in the linear regime is
![]()
In addition to the typical representation of moduli (G', G"), linear data can be equivalently represented by directly measured primary variables, torque amplitude and phase difference (T0, d) as well as other transformations like complex modulus and phase (G*, d), dynamic viscosities (?', ?"), compliances (J', J") and fluidities (?', ?") etc. Figure 1 shows these representations for six repeat measurements on a 1,4-polyisoprene melt.
For fitting the linear data, apart from the data representation subjectivity, we have various subjective choices for weighting the least-squares sum. These two sources of subjectivity are summarized in Table 1.
We consider fitting the linear data using a single mode Maxwell model, with results shown in figure 2. The fit parameter estimates vary significantly with experimental data representation and the weighting (with the commonly used choices of 1 or experimental data) used for fitting. This raises the questions: Which representation and what weighting gives the best estimate closest to the true value for the parameters.
The answers to the above two questions lie in the fact that least-squares is an unbiased estimator only if the underlying distribution is Gaussian3. Hence, we have to find the representation which is closest to Gaussian and weight the residuals using the standard deviation of the data.
In a strain-controlled oscillatory test, the digitized torque values are correlated against two reference signals, one in phase and one 90° out of phase with the displacement signal as shown in figure 3 to give4:
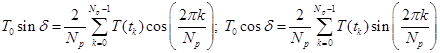
where Np is the number of discrete points used for correlation, typically fixed at 20485. Since these are weighed sums of a large number of random quantities (in this case, noisy torque measurements), they tend to be Gaussian according to Central limit theorem (CLT)3. Since G' and G" are related to these sums linearly as:
![]()
they also follow Gaussian distributions. As viscosities are related to moduli linearly, they are also Gaussian. Other representations, though, are nonlinearly related to moduli and hence, non-Gaussian based on probability transformation rule. Hence, based on this theoretical justification, the best representation for linear data is dynamic moduli or viscosities.
Linear data fitting weighted by experimental uncertainty (given by standard deviation of repeat measurements) significantly reduces the scatter in fit parameter estimate as shown in figure 4. With this weighting, the fit parameters for all representations are much closer to the theoretical best (moduli or viscosity fit). Thus, the use of repeat measurement uncertainty as weights for fitting LVE data significantly reduces the effects of data representation subjectivity.
Impact
This funding has allowed the PI to support one graduate student and also supported time for himself to collaborate with a colleague. The student has thrived with this funding, having earlier presented this work at the 2014 and 2015 annual meetings and another poster scheduled next year at 2017 Annual Meeting of The Society of Rheology (February12-16, Tampa, FL).
References:
1. Ewoldt & Bharadwaj, Rheol. Acta 2013
2. Freund & Ewoldt, J. Rheology 2015
3. Hess et al, Numerical recipes 2007
4. Velankar & Giles, Rheology Bulletin 2007
5. T.A. Instruments, Inc. ARES User Manual (2003)
Figures:
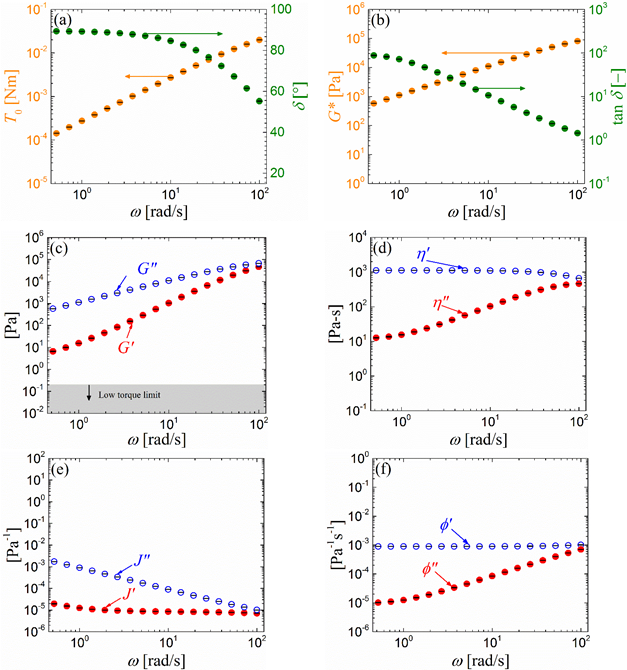
FIG. 1. Different representations of the linear data on 1,4-polyisoprene melt with error bars showing standard deviation from six repeat measurements.
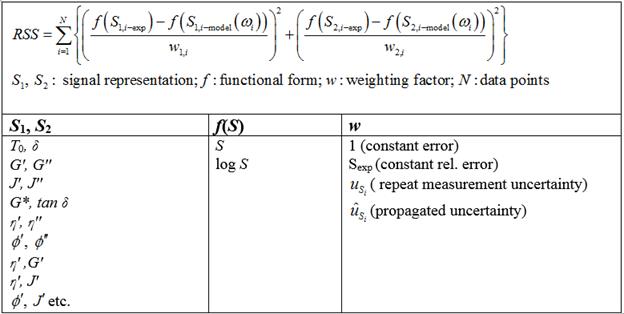
Table. 1. Subjectivity involved in fitting linear data: representation and weighting.
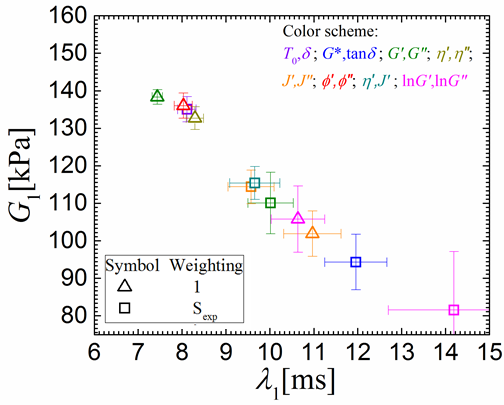
FIG. 2. Uncertainty in fit parameter estimate due to subjectivity of linear data representation and weighting.
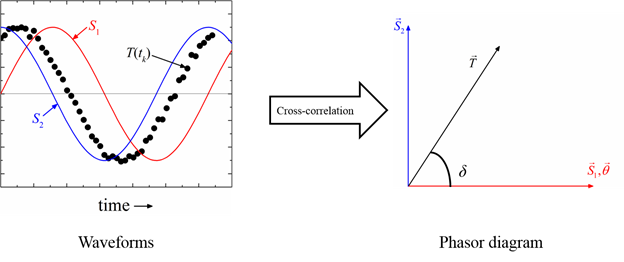
FIG. 3. Primary output variables measurement process for linear oscillatory shear.
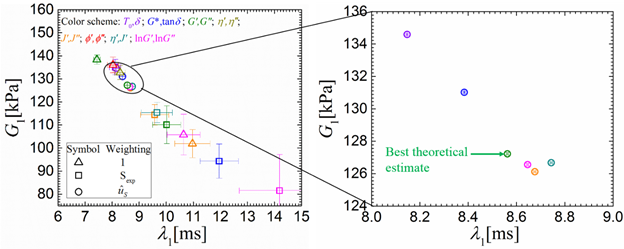
FIG. 4. Uncertainty reduction in fit parameter estimate using repeat measurement uncertainty weighting; best theoretical estimate is for G', G" representation as it is consistent with the underlying Gaussian noise assumption