Reports: DNI1054190-DNI10: A Novel Integrated Design for the Mixed Ionic-Electronic Conducting (MIEC) Perovskites
 printer friendly
In the current project, the CALculation of PHAse Diagram (CALPHAD) approach was adopted for the thermodynamic calculations. The CALPHAD approach was pioneered by Kaufman to model complex phase equilibria in multicomponent systems. Its theoretical basis is thermodynamic description of individual phases.
The thermodynamic database was developed/combined using Thermo-Calc. Thermo-Calc is a program developed by KTH Royal Institute of Technology in the 1970s. For over 40 years, Thermo-Calc has been at the forefront of scientific software and databases for calculations involving computational thermodynamics.
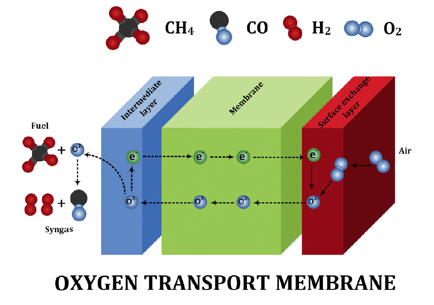
Figure 1. Schematic of oxygen transport membrane
Figure 1 shows a schematic of oxygen transport membrane. The system consist of three layers i.e. air electrode (surface exchange layer), oxygen transport membrane and fuel electrode (intermediate layer). Oxygen molecules from air dissociate into oxygen ions at the air electrode, migrate through the membrane, and recombine with the electron to form oxygen molecule on the fuel side. The driving force for the selective oxygen transport is the existence of oxygen partial pressure gradient. Air and fuel electrodes are used to enhance surface exchange kinetics and improve the oxygen flux performance of OTM system. Wide spread implementation of the aforesaid, however, remains critically limited by the current unfavorable economics, unproven reliability and lack of longevity. The thermodynamic understanding of the perovskite like (La,Sr)(Cr,Mn)O3 and fluorite like YSZ are thus very important.
1. Thermodynamic Stability of (La,Sr)(Cr,Mn)O3 perovskite for OTM
(La0.75Sr0.25)0.95Cr0.7Mn0.3O3 (LSCM-73) experiences enhanced densification in air during sintering at 1400oC when compared to reducing atmosphere. Spinel phase formation (MnCr2O4) has been observed when sintered in air (0.21 atm) and N2 (~10-5 atm) whereas Mn3O4 phase formation is observed at lower oxygen partial pressure (~10-5 and ~10-10 atm) as shown in Figure 2.
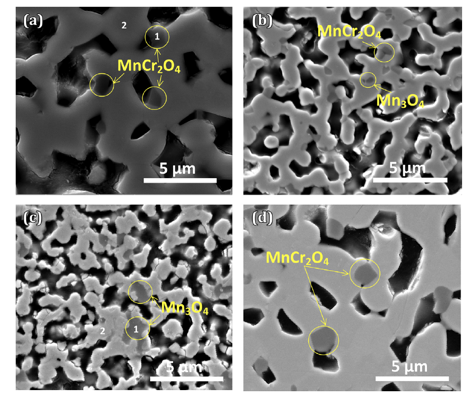
Figure 2 Polished surface SEM micrographs of sintered LSCM-73 in a) air, b) N2, c) Ar-3%H2-3%H2O, and d) air (with 0.5% SrCrO4).
Thermodynamic calculations as well as construction of phase diagram, developed using Thermo-Calc software, supports experimental observations. The customized thermodynamic database for La-Sr-Cr-Mn-O-H-S system was adopted in the current investigations, which is able to simulate the phase equilibria of perovskite at various gas conditions including the gas species like H2O, O2, SO2, H2S, etc. It is a combined database with the La-Sr-Cr-Mn-O database and SSUB database. It has the Gibbs energy description of all the phases we are interested in the current work, including the perovskite and spinel phases. It is expanded by adding Cr on the basis of the La-Sr-Mn-O thermodynamic database, which was initially developed to consider the Cr poisoning effect to LSM.
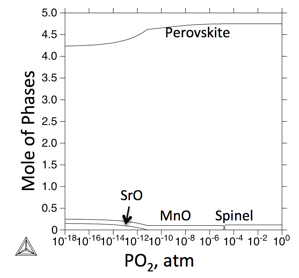
Figure 3. The relationship between the phase stabilities of LSCM-73 at 1400oC and oxygen partial pressure.
In the current work, the phase stabilities of LSCM-73 at different oxygen partial pressures at 1400oC were simulated in comparison with the experimental observations.
According to the prediction, LSCM-73 will form small amount of spinel in air, with the decrease of the oxygen partial pressure, phases like MnO and SrO will form, because of the solubility change of perovskites at different oxygen partial pressure.
With this experimental and thermodynamic prediction combined approach, we will be able to identify the appropriate LSCM composition for the OTM application.
2. The Phase Stability of YSZ
Due to attractive properties of nano particles because of their effective surface area, they have been studied widely. Nano yttria-stabilized zirconia (n-YSZ) is a ceramic, which has been scrutinized extensively during past years. Because of different stability behavior of n-YSZ in comparison with bulk YSZ, a new phase diagram is needed for n-YSZ system in order to identify stable phases in various conditions. In this study, a phase diagram for n-YSZ system was provided to determine phase stability ranges at room temperature with respect to particle size and composition. The CALPHAD approach was applied to calculate the Gibbs energy of bulk YSZ. It was combined with the surface energy of each phase in n-YSZ system i.e. monoclinic, tetragonal, cubic, and amorphous to produce the total Gibbs energy of each individual phase of n-YSZ system. By applying the CALPHAD approach, a 3-D phase diagram for n-YSZ system was established in which the stability range of each individual phase can be predicted based on the particle size, composition, and temperature.
Figure 4. The phase diagram for n-YSZ system at room temperature in comparison with the experimental data which represent experimentally measured crystal structure by Drazin and Castro. sign indicates the largest tetragonal pure zirconia particle size experimentally observed. (M: Monoclinic, T: Tetragonal, C: Cubic, A: Amorphous)
The phase diagram for n-YSZ system at room temperature was developed with the bulk Gibbs energies from the CALPHAD approach and specific surface energies of each crystal structure. By the advantage of the CALPHAD approach characteristics, the total Gibbs energy of n-YSZ system at higher temperatures was predicted and the 3-D diagram for zirconia rich side was developed at temperatures up to 500ûC for the first time, by which the stability range of each phase in n-YSZ system is predicted based on particle size, composition, and temperature. Based on the 3-D diagram, the c-ZrO2 and t-ZrO2 regions become more stable and wider when temperature increases while the m-ZrO2 region shrinks. It was shown that the CALPHAD approach plays a pivotal role to design a predictive phase diagram for nano particles. It was indicated that the CALPHAD approach is capable to be used for predicting the Gibbs energy of amorphous phases by considering few assumptions.
By combining the phase diagrams at different temperatures, a 3-D phase diagram was achieved in which the phase regions are predicted based on the particle size, mole fraction of yttria and temperature. Figure 5 indicates the 3-D phase diagram for n-YSZ system from different angles.
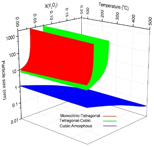
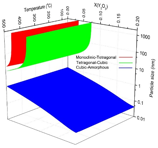
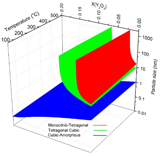
Figure 5. The 3-D phase diagram for n-YSZ system from different angles.