Reports: ND254853-ND2: Formation and Early Diagenesis of Microbialites in Storr's Lake, San Salvador, Bahamas: An Alkaline Earth Metal Isotope Investigation
 printer friendly
Accomplishments during our first year of the funded proposal include recruitment of a graduate student at UT Arlington, preparation for and field work on San Salvador Island in the Bahamas in January 2016 and initial results and method development outlined here.
Four students participated in the field trip to San Salvador Island in the Bahamas coordinated through Gerace Research Center. One undergraduate student from Missouri University of Science & Technology (MS&T) with Dr. David Wronkiewicz, one undergraduate from UT Arlington with Dr. Liz Griffith, and two graduate students from UT Arlington participated. One of the graduate students was recruited to come to UT Arlington to work on this project due to his prior experience working in a clean lab in China and analyzing magnesium isotopes. He started in August 2015. The undergraduate student from UT Arlington decided to stay at UT Arlington to do a M.S. degree working with some of the samples from the field trip. She started the graduate program at UT Arlington in January 2016 after the field trip and worked over the summer on the project with partial funding from an internal university research award to Griffith.
In total, 25 field sites were established and in situ water analysis (temperature, conductivity, pH) were completed with additional analyses of alkalinity and turbidity in the field and Mg and Ca hardness at the field station. Water samples (n = 30) were also taken and filtered at these locations for cation and anion analysis back at UT Arlington (cations and isotopes) and UT El Paso (anions). Permission was granted prior to the field work so that microbialite samples could be collected and brought to UT Arlington. In total, 28 microbialite samples were collected at these same locations in Storr's Lake (Figure 1). This included calcareous knobs, plateau-mushroom, pinnacle mound, and cauliflower-top mushroom. The water and microbilaite samples were inventoried and a few were subsampled in April so that Wronkiewicz and Paul (postdoc at MS&T) could begin initial work making thin sections (Figure 2) and collecting X-ray diffraction from these same subsamples that will be prepared and analyzed for isotope work.
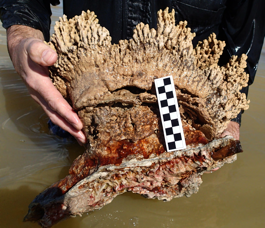
Figure 1 – Field photo (January 2016) of microbailite sample (WS1) collected from the southern sector of Storr's Lake in 111 cm of water found growing on what is likely a mangrove branch dated to be 2120 ± 30 BP (Cal BC 340 to 325 or Cal BC 205 to 50, 95% probability) by Beta Analytical. Scale marked at 1cm increments.
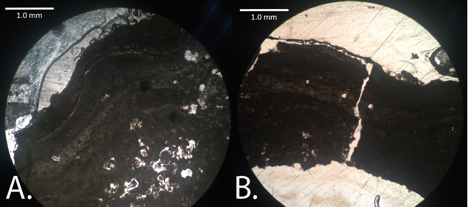
Figure 2 – Images from thin sections made from epoxied dried microbialite sample (EN2) from the northern sector of Storr's Lake in 55 cm of water shown at 4X magnified. The lighter background is epoxy material.
Analysis of the major cations in the waters was completed at UT Arlington at the Shimadzu Center for Environmental Forensics and Material Science in the Geosciences Building on the Shimadzu ICPES 9000. Analysis of chloride and sulfate concentrations were completed at UT El Paso on the Dionex ICS-2100 system. The results are summarized in Figure 3.
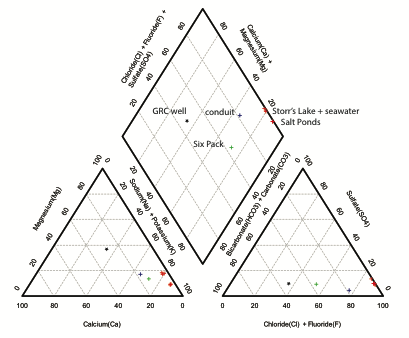
Figure 3 – Piper diagram illustrating representative geochemistry of waters sampled.
Methods are under development for preparation of waters and solids for Mg and Ca isotope analysis. Calibrations of column methods for complete separation and recovery of Mg and Ca were tested in the clean lab at UT Arlington. This is required for accurate isotopic analysis of the samples at the Metal Isotope Laboratory at Penn State University.
Initial analysis of thin sections show typical layering seen on the top of the microbialites (Figure 2A). Figure 2B also shows layering, on the top of the microbialite, with a layer of high density of porous spots. A thin layer of dark-colored, organic material can also be seen can be traced across the top of the microbialite.
X-ray diffraction (XRD) was employed to assist in the evaluation of microbialite mineralogy. Three separate layers in microbialite EN2 from the northern sector of Storr's Lake (EN2-4A, EN2-7A, and EN2-12) were sampled, and an additional sample was selected from WS1 from the southern sector of Storr's Lake (WS1-6A). All samples were hand-picked from individual layers within the half-sectioned microbialite, gently hand crushed in an agate mortar and pestle, rinsed three times with deionized water to remove soluble salts and low density organic particles, and then dried at 55°C overnight. Samples were then press-mounted into sample holder disks and scanned between 6 to 90° two-theta at a scan rate of 2.8° (2-theta) per minute with a CuK_ radiation source.
All four samples displayed a positive two-theta angle shift in the position of the d104 peak, a feature indicative of partial substitution of the smaller-diameter Mg ions into the Ca positions of a hexagonal calcite structure (Figure 4). Calcite with a pure CaCO3 composition will display a two-theta peak position of 29.4 degrees, while the Storr's Lake samples displayed diffraction peak between 29.825 to 30.050 two-theta. These shifts correlate to d-spacings between 2.9956 and 2.9737 angstroms and molar compositions for a Mg-rich calcite between Ca86Mg14CO3 and Ca78Mg22CO3 (Zhang et al., Am. Min. 2010). A preliminary estimate of the relative proportion of aragonite versus Mg-rich calcite was made for samples EN2 and WS1 by direct peak height comparisons for calcite at ~39.34 and aragonite at 46.06 two-theta. The four samples fell within a relatively narrow range between 75 to 83% Mg-calcite and 25 to 17% aragonite. Preliminary data from a single microbialite sample located at WN7 at a water depth of ~1.5m in the northern sector was investigated independently and displayed a higher aragonite to calcite ratio.
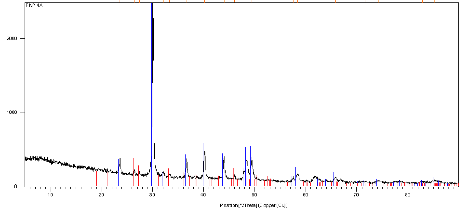
Figure 4. X-ray diffraction (XRD) analysis of layer 4A in microbialite sample EN2. Black curve represents sample spectral analysis line, blue lines represent spectral pattern for standard sample 01-086-2336 (Mg-calcite with 12.9 mole % Mg), red lines represent spectral pattern for standard sample 01-071-2396 of aragonite. Note positive shift of spectral line at 30 degrees two-theta relative to the 12.9 mole % Mg-calcite standard.