Reports: ND855903-ND8: Passive Seismic Investigations for the Formation Mechanisms of Intracratonic Basins
 printer friendly
We have obtained all the three-component broadband seismic data from the Incorporated Research Institutions for Seismology (IRIS) Data Management Center (DMC) in the Williston Basin, Michigan Basin, and New Madrid Seismic Zone areas. Data from magnitude 5 or greater earthquakes in the teleseismic distance (30 to 180 degrees) are requested and processed.
Due to the existence of a loose sedimentary layer of a few km or thinner in the study areas, prominent high-amplitude and low-frequency reverberations are produced. We have used a reverberation removal receiver function method developed before and applied the technique to the data in the study areas to remove the multiples and to determine the structures beneath the loose sedimentary basins (Figure 1).
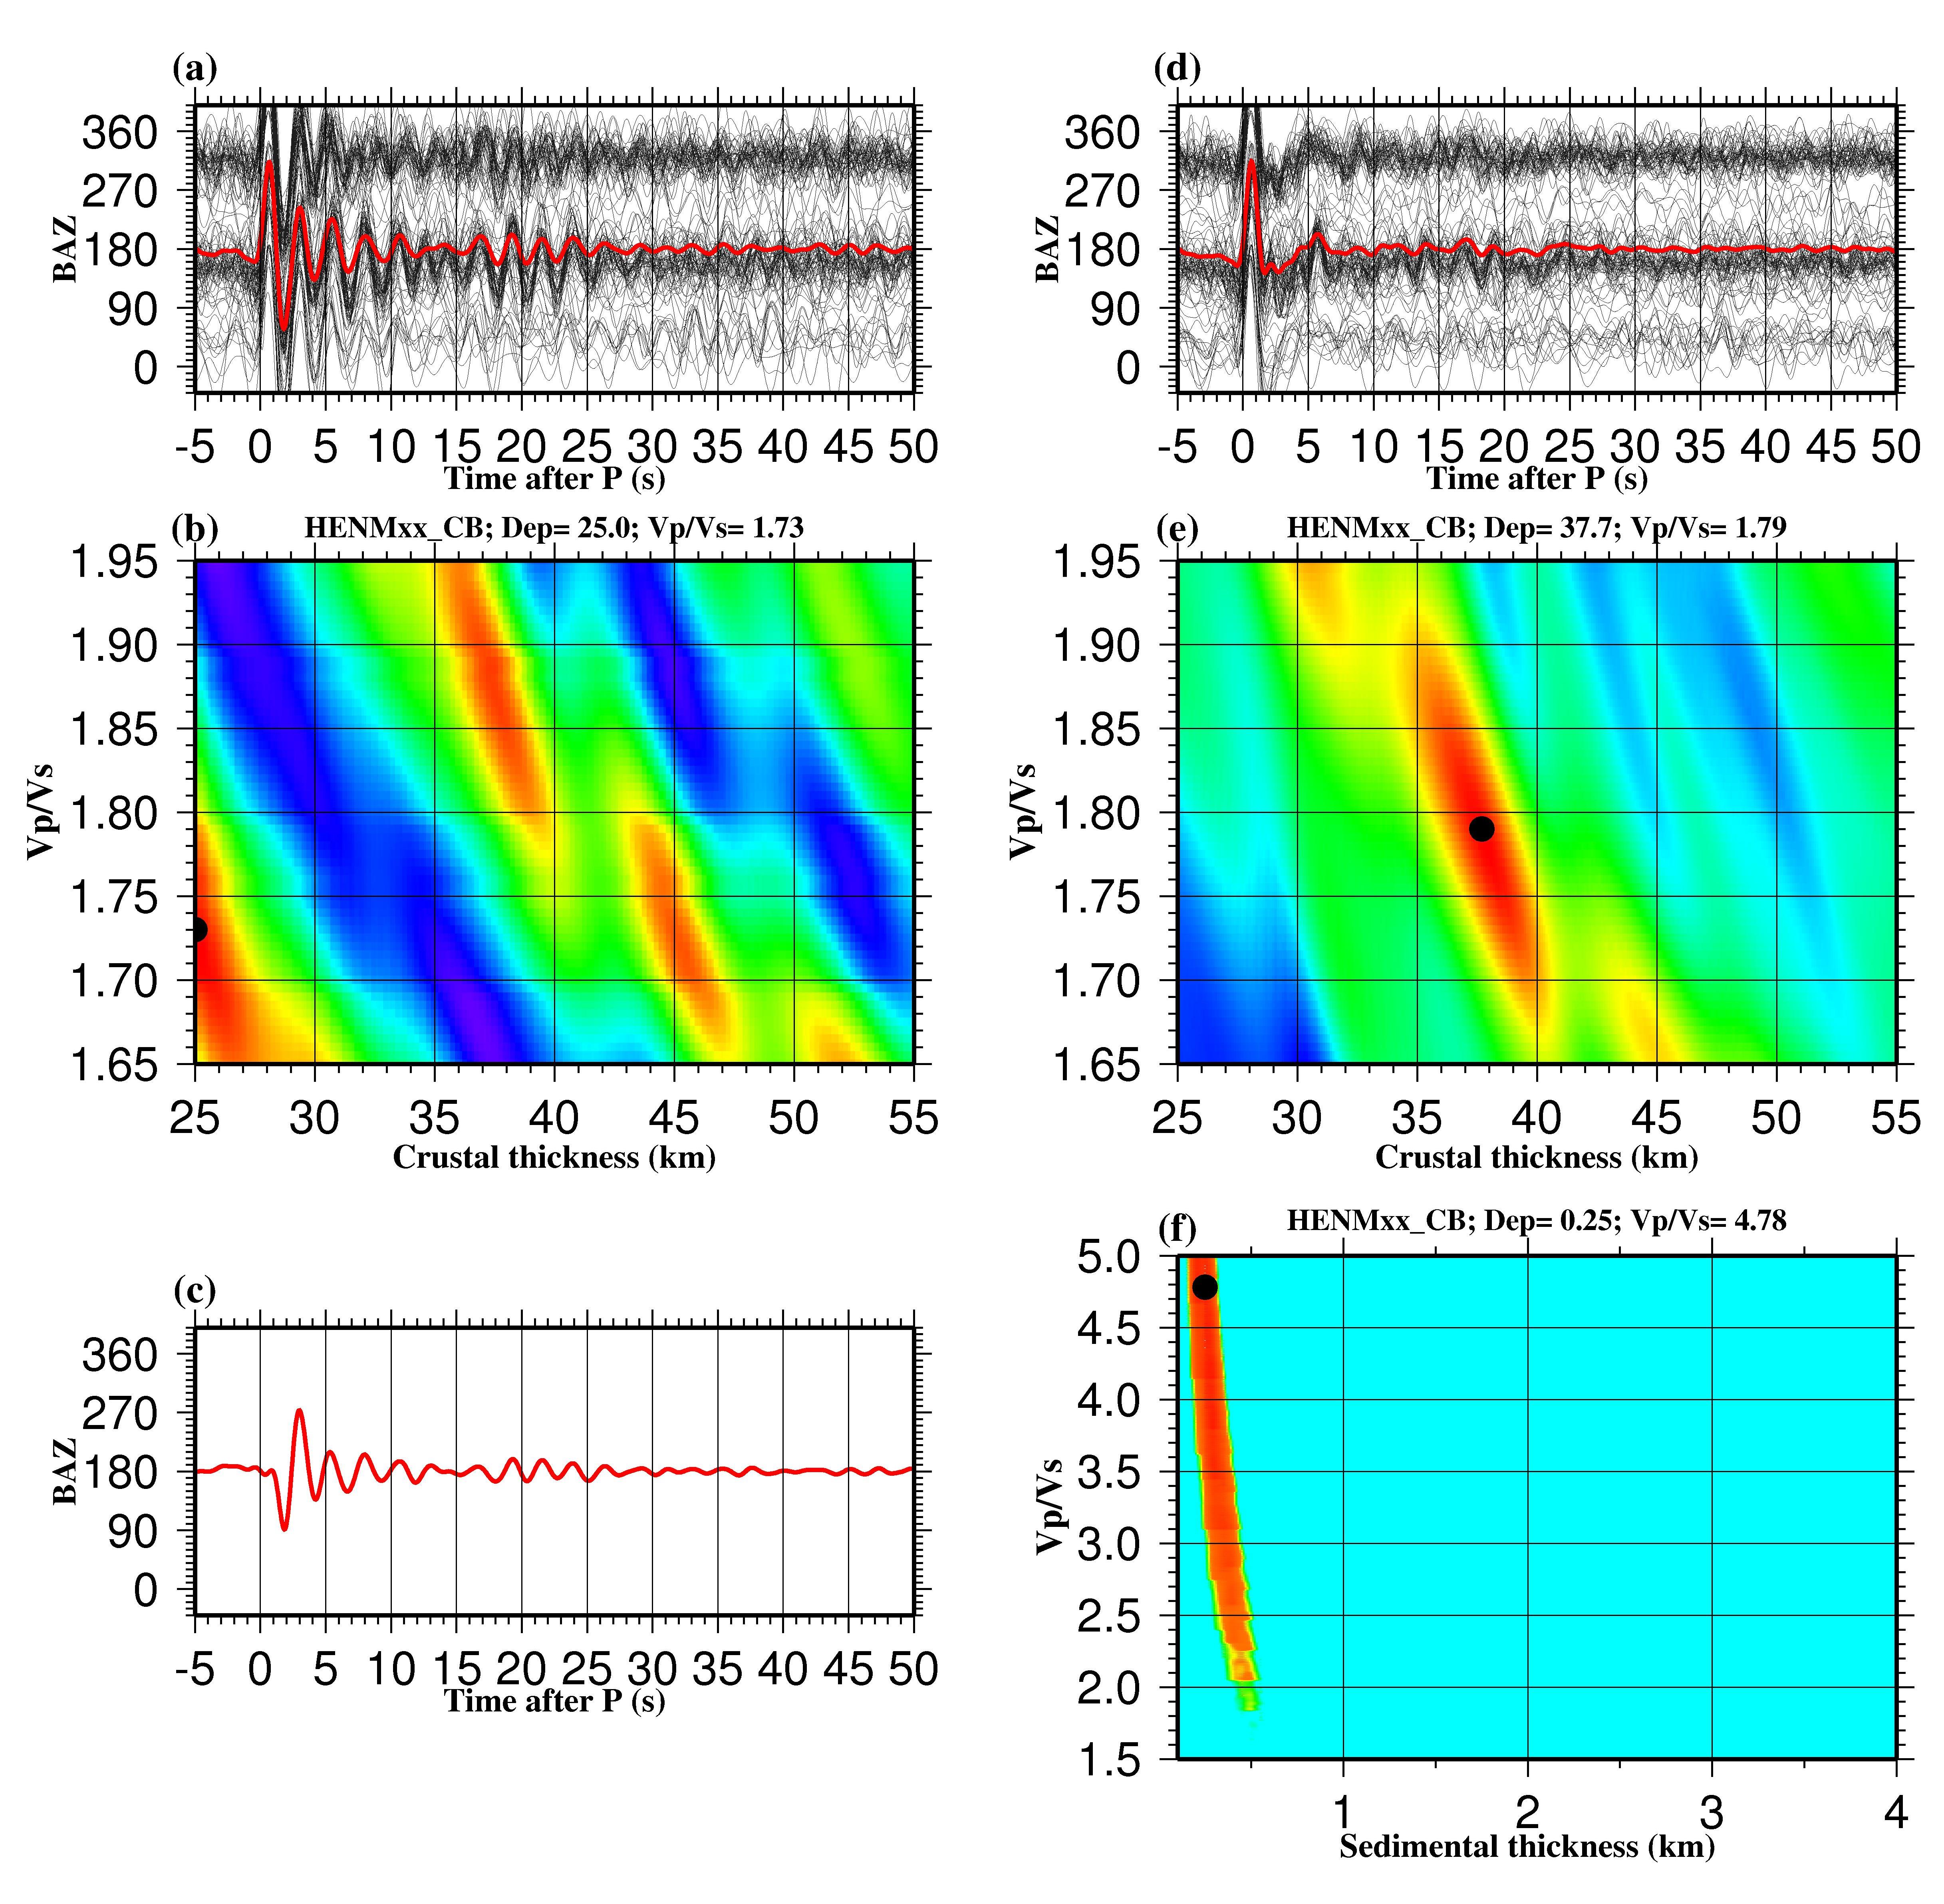
Figure 1. (a) Original receiver functions plotted against back-azimuth. The red trace is the result of simple time domain summation of the individual traces. (b) Stacking using the receiver functions shown in (a). (c) Differential time series between the red line in (a) and that in (c) showing the ”pure” reverberations. (d) Resulting receiver functions after removing the reverberations. (e) Stacking using the filtered RFs (c). (f) Stacking for the sedimentary layer.
v New Madrid Seismic Zone and Illinois Basin crustal thickness and Vp/Vs ratio
In the New Madrid Seismic Zone and Illinois Basin area, stacking of a total of 7627 radial receiver functions recorded by 49 stations shows systematic spatial variations in crustal thickness and Vp/Vs ratio of the converted Moho phases among different geological provinces. The crustal thicknesses range from 26.8 to 50.3 km with a mean value of 38.4 km (Figure 2), and the resulting Vp/Vs observations of the 33 well defined stations range from 1.75 to 1.93 with an average of 1.83 (Figure 3).
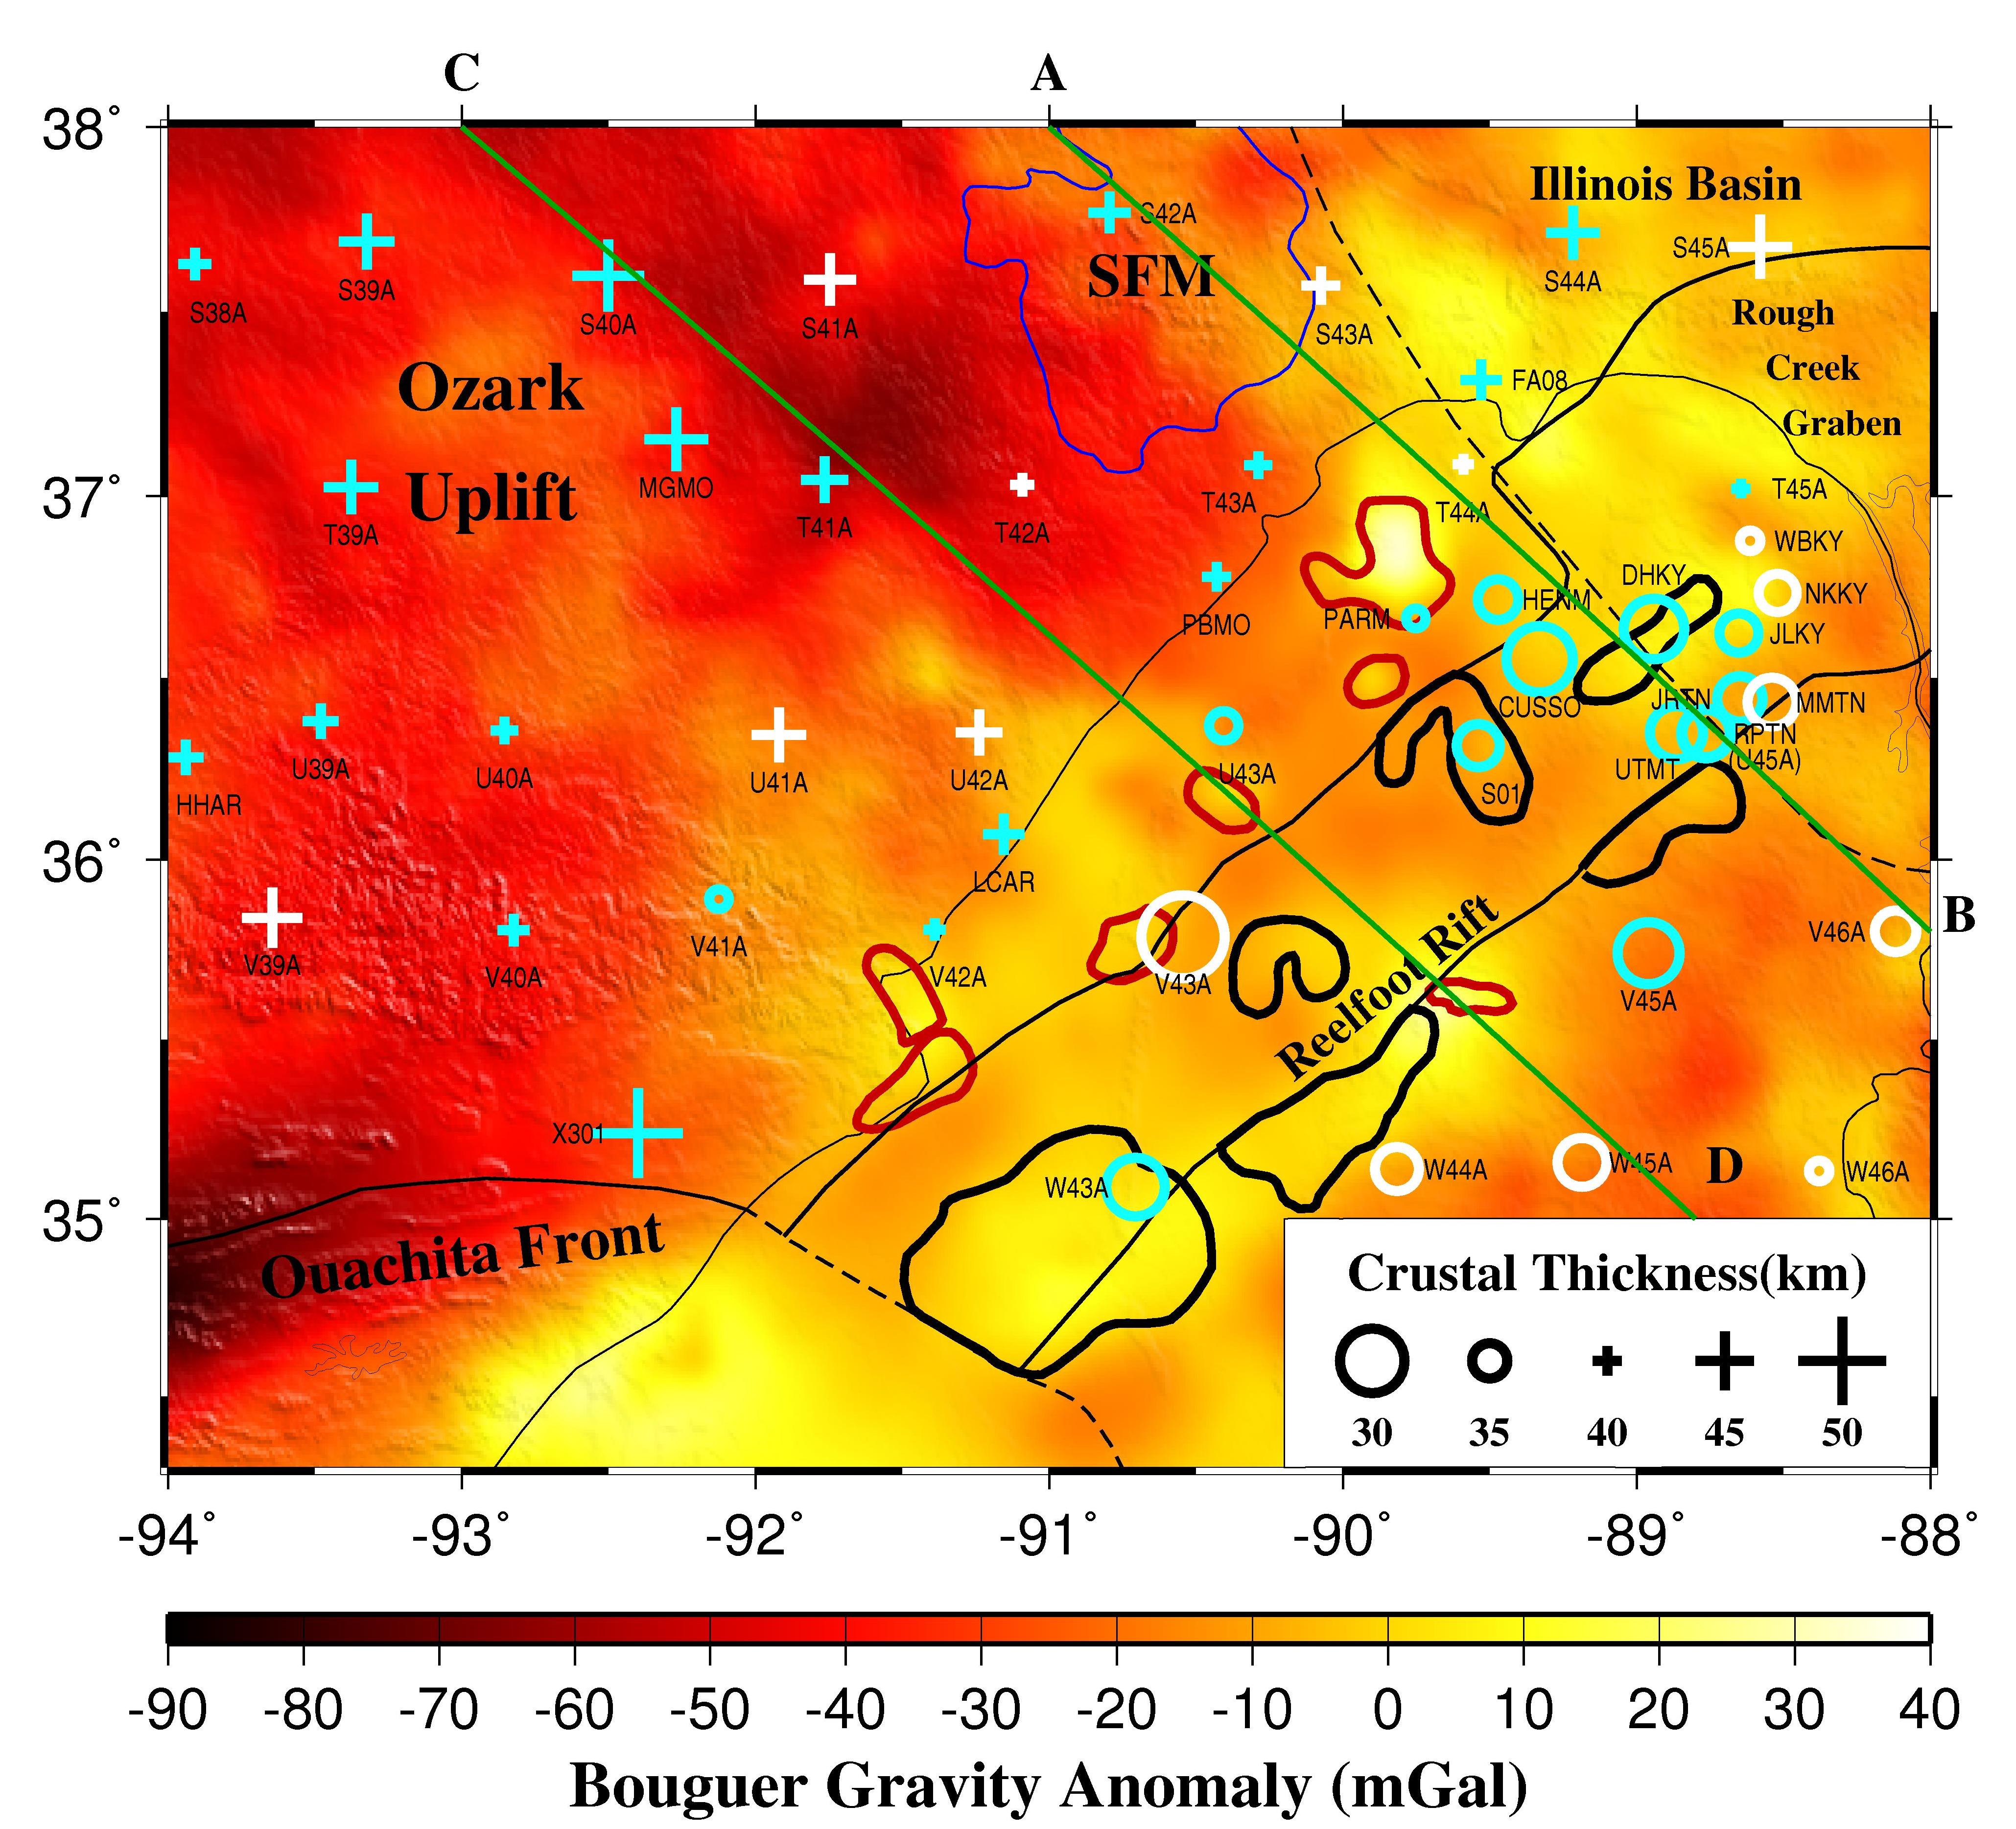
Figure 2. Resulting crustal thicknesses plotted on top of Bouguer gravity anomaly. Pluses indicate the stations with larger H, and open circles indicate relatively smaller crust thickness. Blue symbols represent excellent measurement stations, and white ones represent good measurement stations. Lines A-B and C-D are the location of the gravity model shown in Figures 4 and 5, respectively.
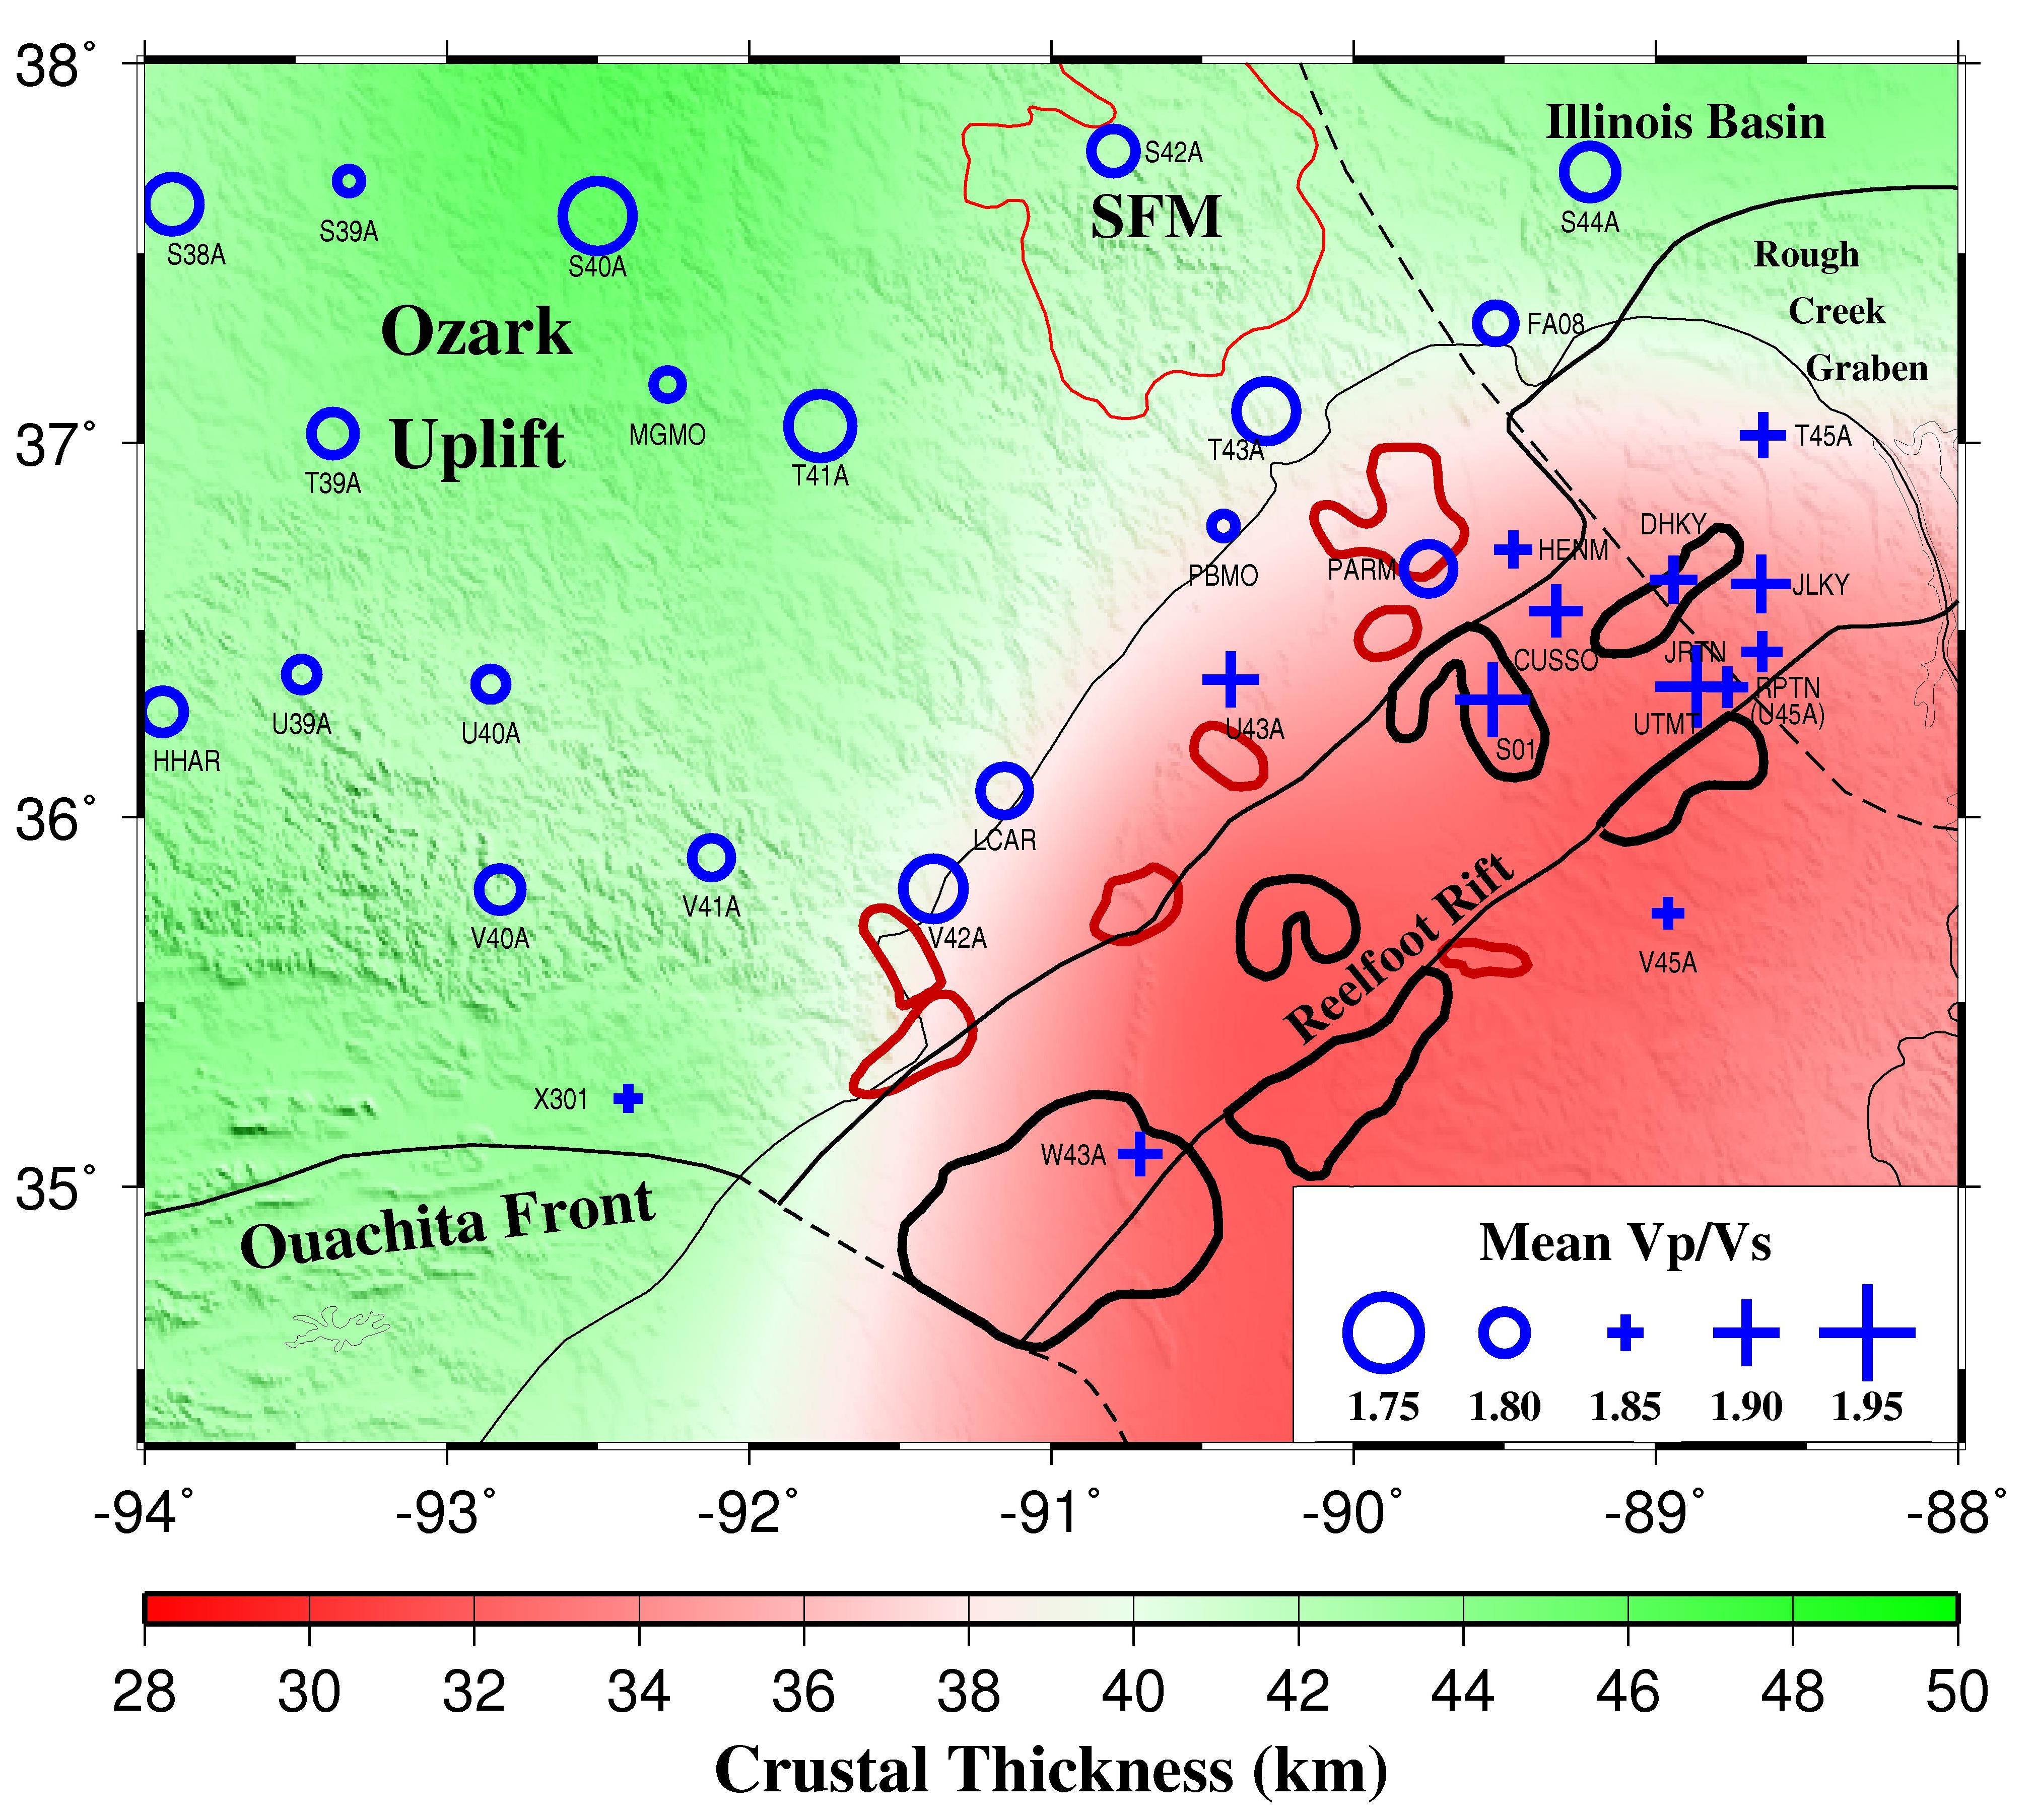
Figure 3. Resulting crustal Vp/Vs ratio. The background images show smoothed crustal thickness of Figure 2. Pluses indicate relatively larger values, and circles indicate relatively smaller values.
Based on geological features and the characteristics of crustal thickness and Vp/Vs distributions, the study area is divided into three sub-regions, including the Ozark Uplift, Mississippi Embayment (Reelfoot Rift and Rough Creek Graben), and Illinois Basin.
Our results suggest that the upper Mississippi Embayment, a broad southwest-plunging trough with the thickest sedimentary layer in the study area, is characterized by a thin crust (~33.9 km), while adjacent areas have thicker crust (~44.0 km). Larger than normal Vp/Vs values of 1.86 or greater are found beneath the New Madrid Seismic Zone, indicating the influence of mafic intrusion and eclogitization related to continental rifting and Bermuda hotspot.
Most part of the Ozark Uplift is characterized by similar crustal thickness (42.5 km) and Vp/Vs values (1.80) with mid-continent craton, which suggests an overall cratonic crust without the influence of mantle plume.
In contrast to the New Madrid Seismic Zone which is part of the Reelfoot Rift with a thinner-than-normal crust and higher-than-normal Vp/Vs values, the southern Illinois Basin, an intracontinental sag basin sampled by 1436 receiver functions recorded at three stations, is characterized by a relatively thick crust (42.0 to 45.9 km) and a small Vp/Vs ratio (1.78 to 1.81), suggesting sharp differences in crustal structure between rift and sag basins.
v Gravity modeling in the Illinois Basin and New Madrid Seismic Zone
We also conducted gravity modeling in this study area. The resulting Bouguer gravity anomaly models along profile A-B and C-D (Figures 4 and 5) show mafic intrusion along the Reelfoot Rift and 10-15 km high-density (3.02 g/cm^3) lower crust layer beneath the New Madrid Seismic Zone, consistent with the distribution of the relatively high Vp/Vs values beneath the upper Mississippi Embayment.
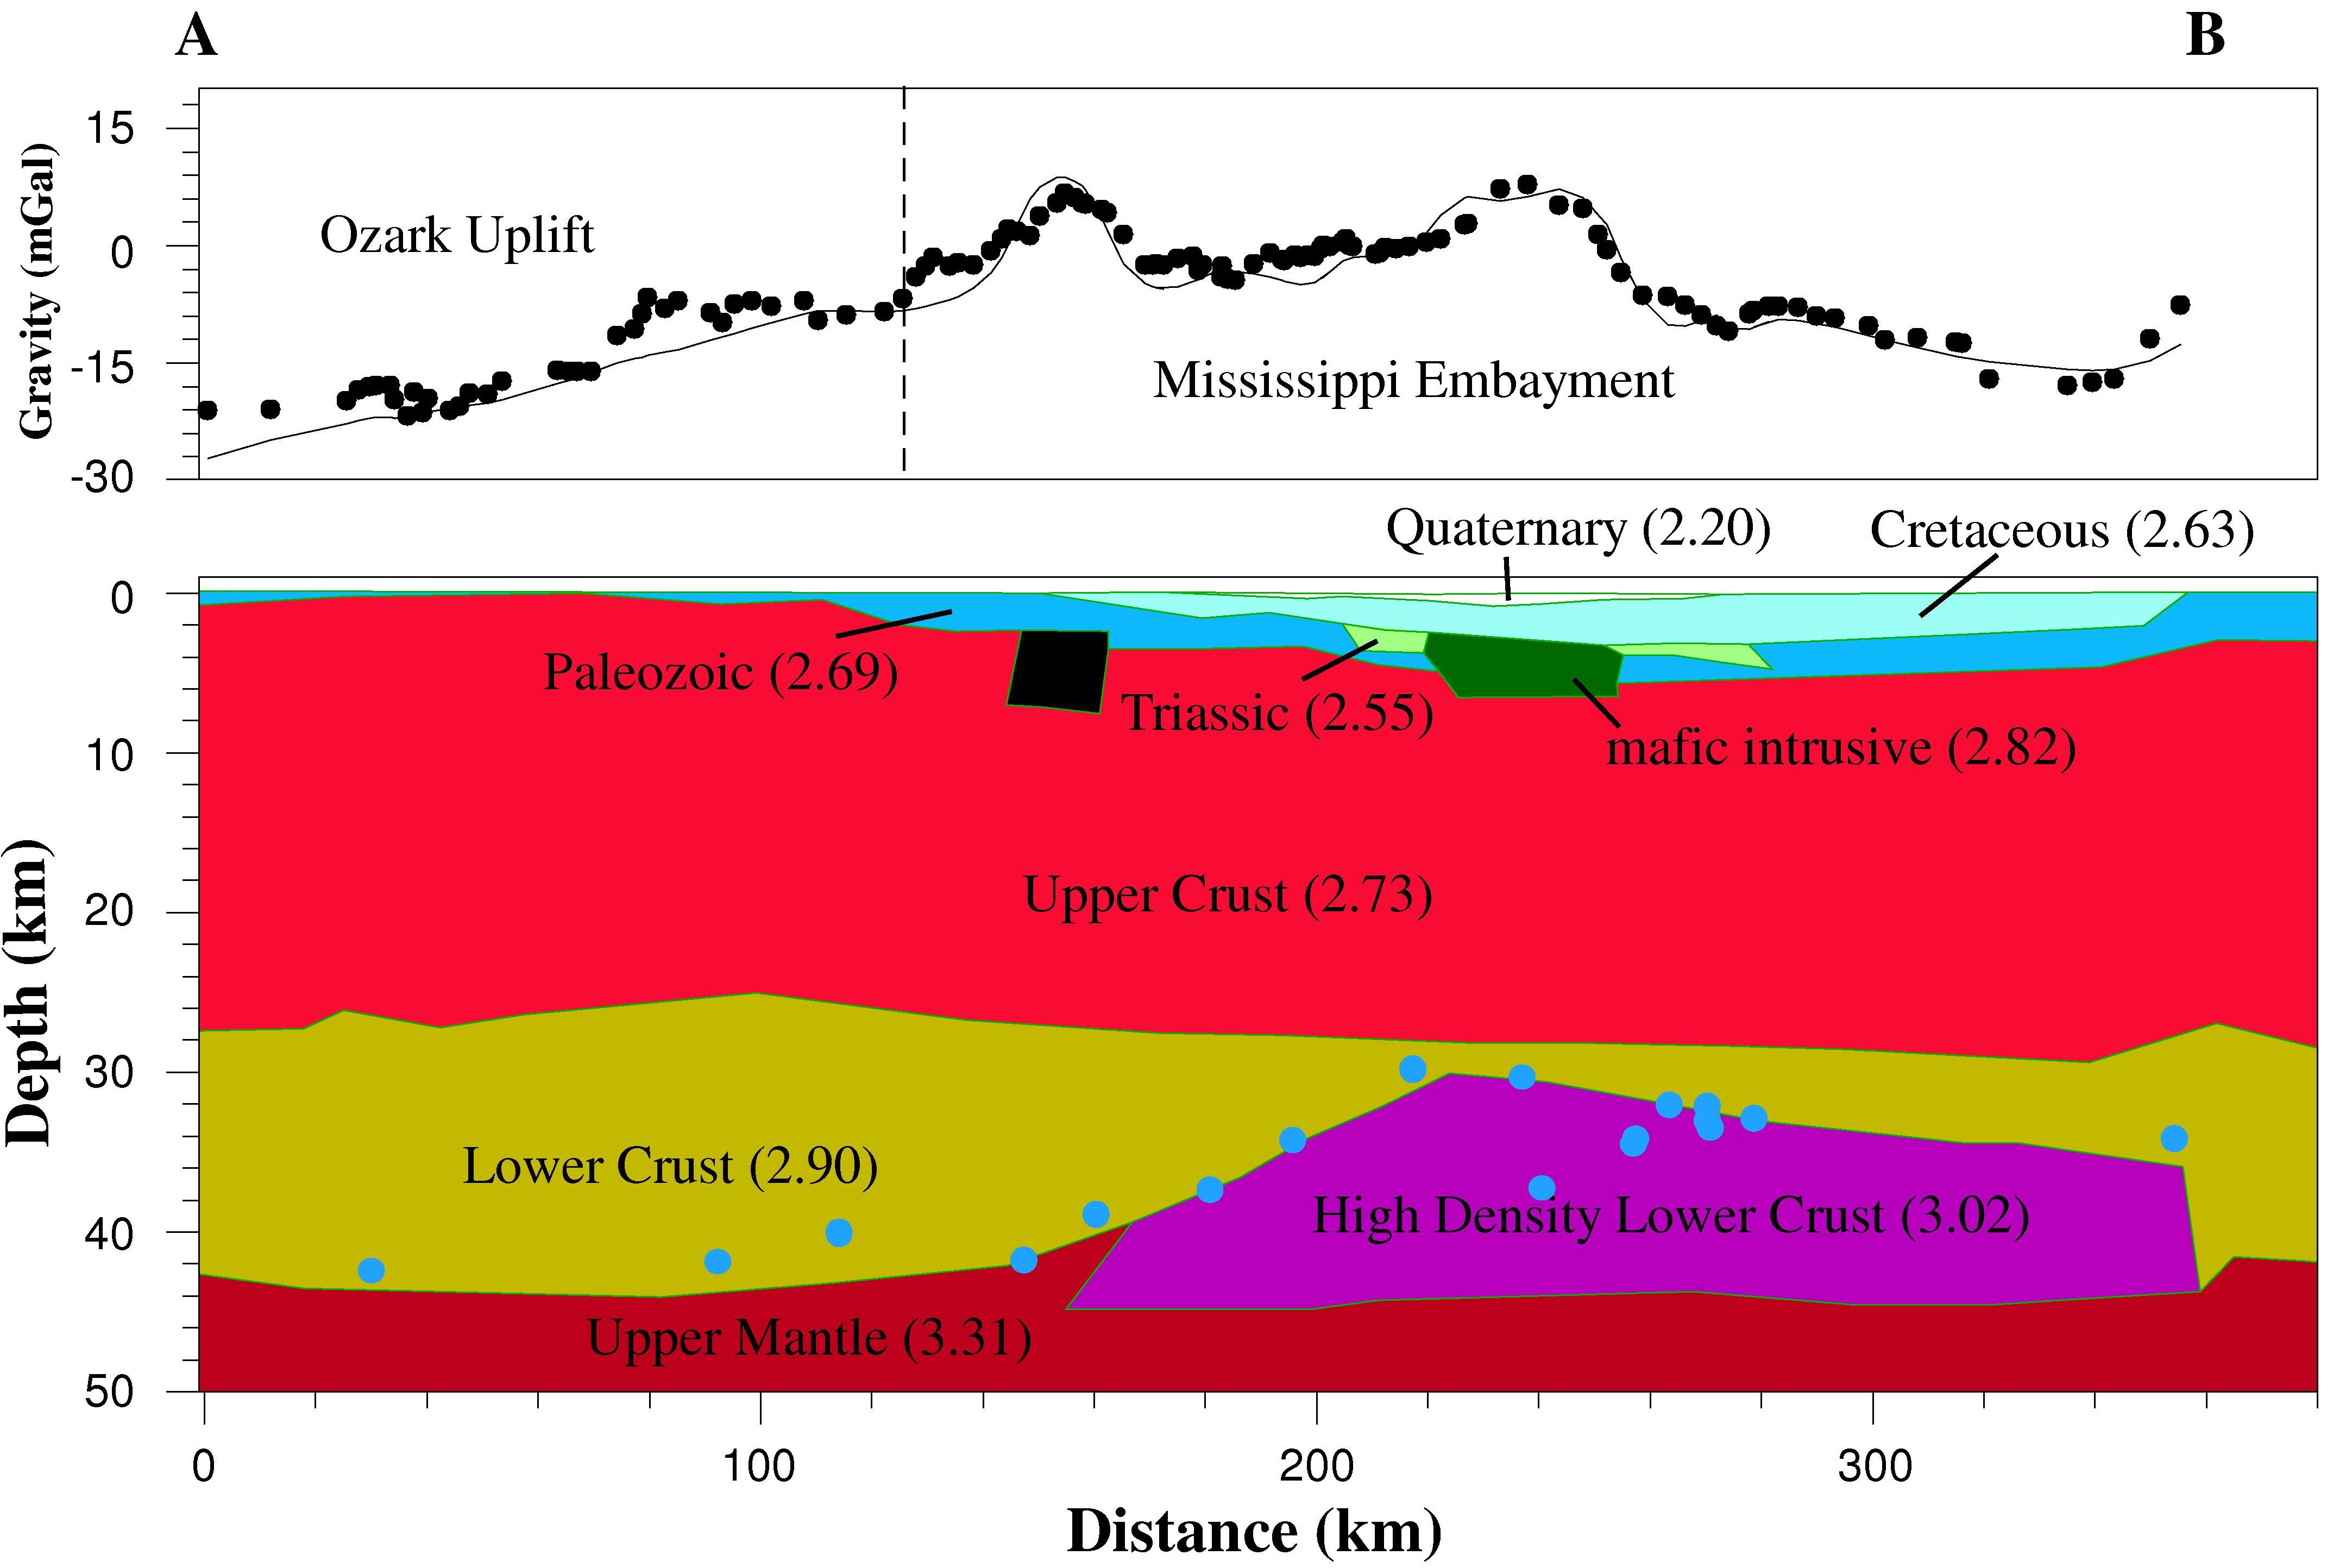
Figure 4. Gravity model of the crust and upper mantle along profile A-B (Figure 2). Densities are in g/cm3. The black dots and line in the upper figure are observed and calculated gravity anomalies, respectively. Blue dots represent crustal thickness measurements at stations in the 100 km wide band centered on the profile.
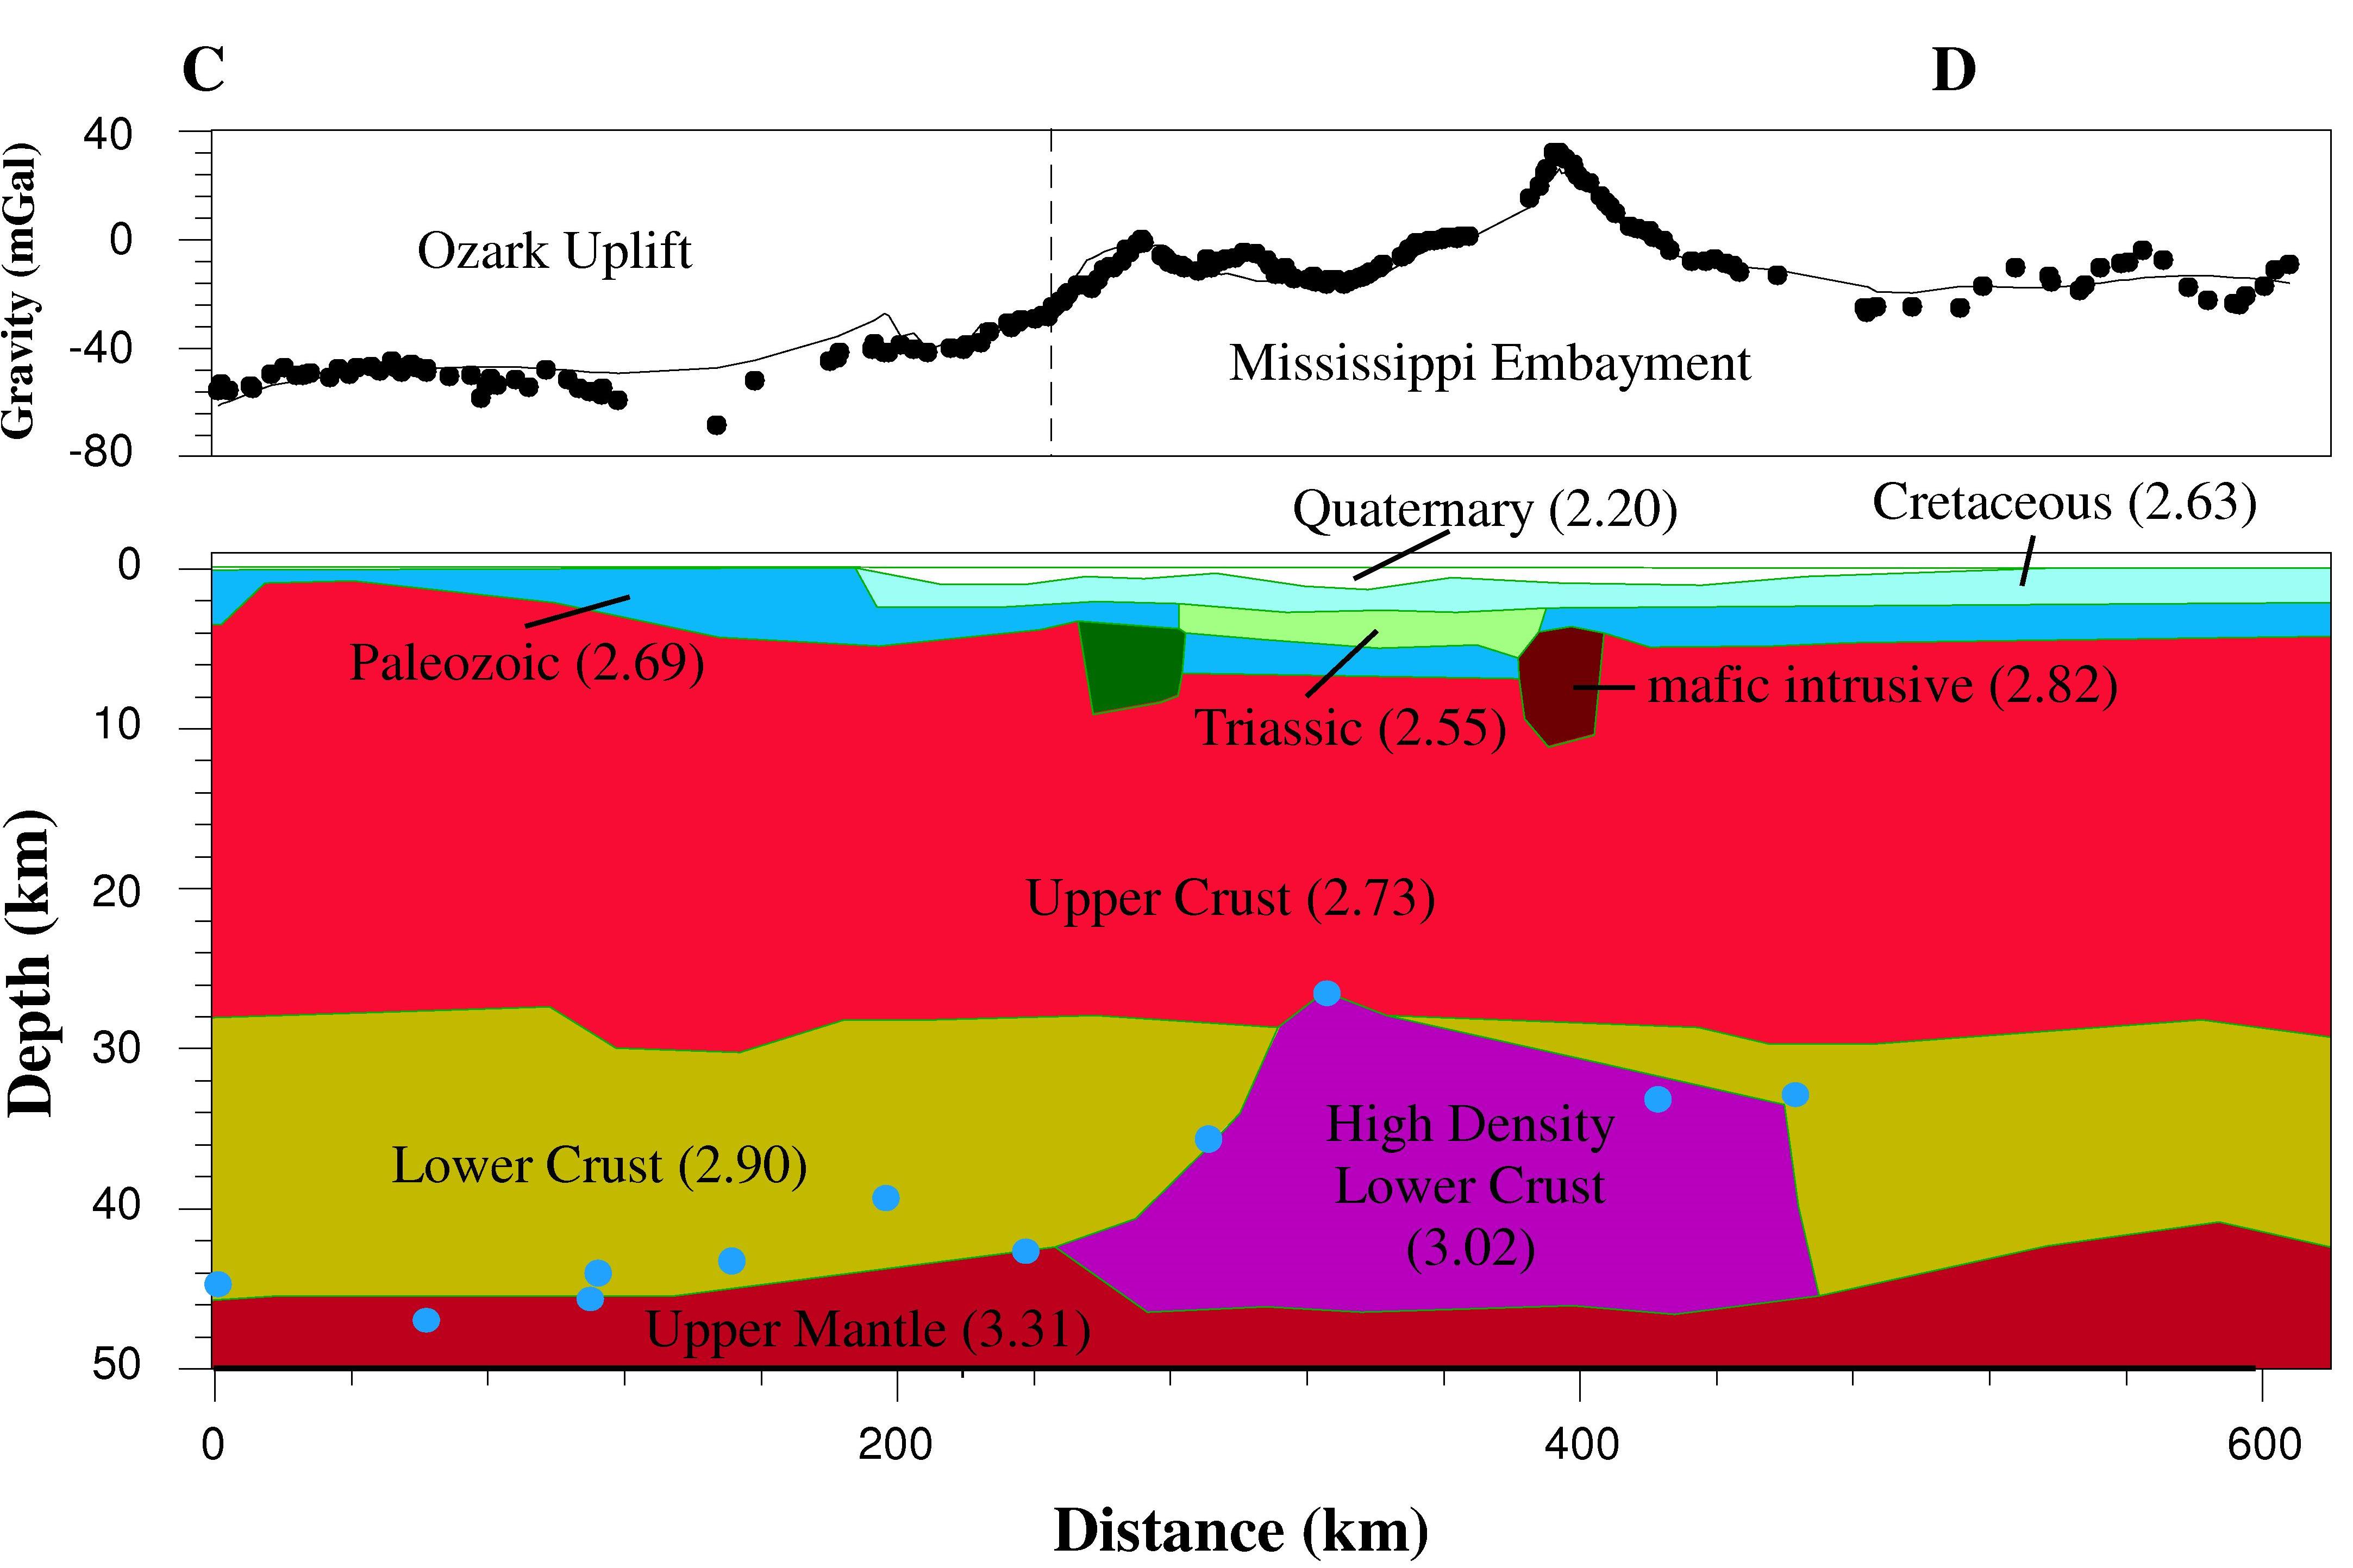
Figure 5. Similar gravity model with Figure 4 along profile C-D (Figure 2).
v Preliminary results in the Illinois Basin and New Madrid Seismic Zone
The seismically-detected relatively thin crust and high Vp/Vs values beneath the upper Mississippi Embayment are the combined actions of eclogitization and mafic intrusion.
Although the southern-most Illinois Basin is the extension of Reelfoot Rift, the thicker crust and lower Vp/Vs measurements reveal sharp differences in crustal structure between rifts and sag basins.
v Career impact
The studying of the formation mechanisms of intracratonic basins is an entirely new research direction for the PI and the students involved. The studies significantly broaden the team’s overall research directions.