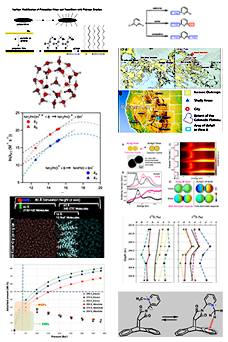
Reports: ND1055176-ND10: Kinetic and Isotope Effects in P-T Phase Diagram of Polycyclic Aromatic Hydrocarbons
 printer friendly
Piezochromism, Structural and Electronic Properties of Benz[a]anthracene under Pressure
We studied the high pressure behavior of a herringbone-type hydrocarbon benz[a]anthracene (BaA) through fluorescence spectroscopy, X-ray diffraction, optical absorption and photoconductivity measurements combined with density function theory (DFT) calculations. We observe BaA exhibits an appreciable and reversible color change from yellow-green to dark orange as pressure applied to ~15 GPa (figure 1). The ambient-pressure molecular phase is found to be stable up to ~15.0 GPa, piezochromism from initial yellow-green to light brown was observed within this range. The reversibility was confirmed by optical observations and fluorescence measurements. Further compression induces amorphization reaction and the sample color turns into dark brown. Synchrotron X-ray measurements with and without PTM demonstrate no appearance of structural phase transition within this pressure range. An irreversible chemical reaction takes place when pressure above 15 GPa. The visible light responses of BaA to pressure, including the changes of band gap and photocurrent demonstrate considerable orbital overlap and increase of charge carrier mobility. DFT calculations reveal that the molecular phase is dynamically stable up to ~117 GPa at 0 K and could not become a metal before transition into a saturated CH polymer. Our studies on BaA provide new insights on the herringbone-type PAHs with different molecular configurations and their electronic properties tunable by pressure.
Figure 1. (a) Optical macrographs of BaA single crystal compressed in silicone oil to 14.2 GPa and released to 0.2 GPa. (b) Another single crystal was compressed up to 40.5 GPa and decompressed to 0.1 GPa.
Figure 2. (a) Microphotographs of BaA polycrystalline sample upon compression to 14.3 GPa at RT. (b) Fluorescence spectra of polycrystalline BaA measured at different pressures. The 0-0 band was partially cut off by the Notch filter below 0.5 GPa. The excitation laser wavelength is 488 nm. (c) Deconvolution of the fluorescence spectra at 0.5 and 8.4 GPa. (d) Vibronic bands shift as a function of pressure.
Figure 3. (a) XRD patterns of BaA polycrystalline with liquid nitrogen as PTM up to 14.4 GPa measured at RT (λ = 0.4066 Å). Asterisks and squares indicate the reflections from solid nitrogen (hexagonal phase) and gasket. (b) Le Bail fit of X-ray data at 1.4 GPa. The black circles are the measured scattering intensity, and the red solid line represents the fit to the data. The vertical bars indicate Bragg reflection positions of the phase P21 together with difference profiles (blue lines) are shown at the bottom.
Strong Isotope Effect on Polymerization of Benzene under Pressure
We used synchrotron X-ray diffraction and micro-Raman techniques to investigate the isotope effects in polymerization and phase transition of benzene (C6H6) and its isotopologue perdeuterobenzene (C6D6) up to 46.0 GPa at room temperature. In addition, the structural phase diagram of C6D6 was studied up to 6.2 GPa between T = 100−300 K using neutron diffraction. We find that both isotopologues crystallize in orthorhombic Pbca phase, which persists up to 2.2 GPa. Further compression leads to a first-order phase transition to a monoclinic P21/c phase, which remains mixed with residual Pbca phase. This mixed phase coexist with the products of chemical transformation. Slow compression-decompression measurements of C6H6 and C6D6 display similar onsets for chemical reaction (~16 GPa) that is significantly lower than the previous value reported for C6H6 (23 GPa). The Raman spectra of polymeric products recovered from different pressures show a pronounced kinetic isotope effect: C6D6 polymerization reaction proceeds considerably slower than C6H6, leading to substantially lower fractions of sp3 bonding in C6D6 polymers recovered from comparable pressures. Kinetically retarded reactions in C6D6 shed light to the mechanism of polymerization pathway of C6H6. In addition, we find that C6D6-derived products recovered from P < 35 GPa actively react with moisture in the air and form polymeric materials with higher sp3 hydrogen contents than their parent compounds.
a
Fig. 1. Raman spectra of (a) C6H6 and (b) C6D6 decompressed from different pressures at RT. The black and blue spectra are from recovered samples immediately after exposure to air and after 24 hours, respectively. The inset in (b) shows the Raman spectra of C6D6 recovered sample (from 28.3 GPa) before and after exposure to the H2O-saturated atmosphere for 2 weeks. (c) Ratios of sp2/sp3 integrated area (black symbols) and sp2/total (total = ∑▒〖[sp〗_(C-H)^2 +〖sp〗_(C-H)^3] for H and ∑▒〖[sp〗_(C-D)^2 +〖sp〗_(C-D)^3+〖sp〗_(C-H)^3] for D) (blue symbols) as a function of pressure. The insets show the deconvolution of C-X stretching bands in C6H6 and C6D6 at 25.1 and 25.7 GPa, respectively.
Fig. 2 (a). Proposed phase diagram of C6D6. The grey dotted and red dashed lines indicate suggested phase boundaries of C6H6 [17,26] and P-T paths of C6D6 taken in our study. The inset shows the selected neutron diffraction patterns of C6D6. The new peaks (002) and (10¯2) of phase II and (020) of phase I are indicated in olive and black arrows. (b) The third- and second-order Birch–Murnaghan (phases I and II) EoS fits to the molecular volume Vm (V/Z) data of C6D6 and C6H6 . The open circles indicate decompression neutron data. The phase transition at ~2.2 GPa is indicated by vertical red dashed lines. Raman spectra of (c) C6H6 and (d) C6D6 as a function of pressure. The aromatic C-H/C-D sp2 stretching modes are shown in olive dashed squares. Thin polymer layer resides in the original boundary of gasket chamber after recovery marked by arrows. Raman spectra in the C-H/C-D stretching region of the recovered product are shown in the upper insets.