Reports: ND954562-ND9: Nanometer-Scale Gas Transport in Shale Reservoirs
 printer friendly
Objective of this project is to develop simple engineering tools and models capable of calculating gas transport through unconventional tight porous shale reservoirs. This is a multi-physics problem. First, gas flows in nano-porous media experience rarefaction effects in the entire Knudsen (k) regime so that transport cannot be predicted using the classical Klinkenberg slip correction. Second, van der Waals forces induced on the gas molecules by channel surfaces have significant effects on gas flows in the near wall region. This brings an additional length scale to the problem and violates similitude between the rarefied and nano-scale gas flows; making direct application of kinetic theory (KT) based models inapplicable. Proper approach to investigate this multi-physics problem is the Molecular Dynamics (MD) method.
Gas flows evolve though intermolecular collisions defined by the mean free path, and simulations require sampling of 1000 or more gas molecules for meaningful statistics. Therefore, MD simulations of gas flows require unusually long channels and tubes, where several millions of wall molecules are needed to simulate the motion of about 1000 gas molecules. Such conditions overwhelm the existing MD software and require development of specific algorithms for simulating gas flows. We addressed this need by developing the Smart Wall MD algorithm for nano-channels with FCC surfaces, and Smart Tube MD (STMD) algorithm for cylindrical tubes with hexagonal structures. Rest of this report focuses on an important discovery in nano-channel confinements, and the details of the new algorithm developed for simulating gas flows in cylindrical tubes.
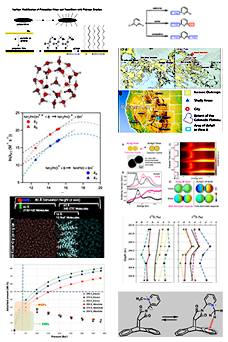
MD simulations of force-driven nano-channel gas flows show two distinct flow regions (Figure 1). While the bulk flow region can be determined using kinetic theory, transport in the near-wall region is dominated by gas-wall interactions. This duality enables definition of an inner-layer scaling, based on the molecular dimensions. Velocity distribution in the inner layer exhibits a universal behavior as a function of the local Knudsen number and gas-wall interaction parameters, which can be interpreted as the “law of the nano-wall” (Figure 2). Knowing the velocity and density distributions within this region and using bulk flow velocity profiles from the Beskok-Karniadakis-Model, (Microscale Thermophys Eng.,1999), we outline a procedure that can correct kinetic-theory-based mass flow rate predictions in the literature for various nano-channel gas flows (Figure 3).
STMD algorithm is developed to investigate gas transport in nano-tubes. Figure 4 shows a gas molecule interacting with the surface of a nano-tube. The effective range of atomic potential is presented as a transparent red sphere. Only a limited number of surface molecules are interacting with the gas particle. Hence, using these as a stencil for gas/surface interactions can enable simulating gas flows in nanotubes. In order to develop a STMD stencil for industrially and geologically relevant nanotube materials such as various forms of silicates, silicon and graphite, honeycomb structures are studied (Figure 5). The STMD stencil requires determination of a repeating universal structure of the corresponding material. Figure 5c shows 3D zones forming between the center line of the nanotube and the self-repeating patterns of the honeycomb structure. There are 2În zones forming a ring of nanotube which repeats through the axial length of a nanotube and eventually forms the whole cylindrical volume. For each nanotube zone, a STMD stencil was determined based on the force effective region from the border of the corresponding zone in both angular (Figure 6) and axial (Figure 7a) directions. For nanotubes bigger than 3nm in diameter, 160 surface molecules form the STMD stencil (Figure 7b). However axial and angular locations of these molecules vary as a function of the nanotube radius. STMD calculates every stencil for a given nanotube and saves it prior to simulations. During MD calculations, STMD determines the nanotube zone where a gas molecule is located and recall the corresponding surface stencil to calculate gas/surface force interaction. Figure 8 shows snapshot of a 20nm diameter and 200nm long zigzag (240,0) nano-tube. Figure 9 shows Kn=0.2 gas flows in 51nm diameter tubes with different surface interaction potentials and the resulting force induced by the STMD stencil on an approaching gas molecule. Figure 10 shows gas density distributions as a function of the gas-wall interaction strength. Mass transport and the corresponding permeability inside various size nanotubes are studied in the entire Knudsen range. Algorithmic development and transport results will be published in the following months.
Figure 1. Velocity profiles for k=1 flows in 10.8 to 54 nm height channels.
Figure 2. Normalized density (a), velocity (b), and mass flux (c) distribution within the wall force penetration region for k=1 flows in different height channels.
Figure 3. Free-molecular scaling of MD measured mass flow rates inside 10.8nm height channel, compared with predictions of KT and our model for various k flows.
Figure 4. (a) Due to the cut-off distance of the van der Waals forces, only a limited number of surface molecules interact with gas molecules. (b) Closer look.
Figure 5. (a) Graphene honeycomb structure, (b) single walled carbon nanotubes of zigzag type, (c) the self-repeating volume in a zigzag (12,0) CNT formed from the hexagonal self-repeating pattern of honeycomb crystal structure, and the resulting angular volumetric zones through self-repeating nanotube ring.
Figure 6. (a) Force effective volume of a nanotube zone in angular direction that extends one cut-off distance from self-repeating zone volume of a nanotube. (b) The force effective volume of a nanotube zone in angular direction for different nanotube sizes.
Figure 7. (a) Effective force range on nanotube surface. (b) Final form of the STMD stencil.
Figure 8. Kn=10 flow in a nano-tube of 10nm radius and 200nm length simulated by STMD algorithm.
Figure 9. (a) STMD simulations of Kn=0.2 flows in 51nm diameter tubes with varying surface interaction potentials (εwf/εff). (b) Surface forces on a gas molecule approaching to the surface through the center line of the hexagonal structure.
Figure 10. Number density distributions of Argon at 600kPa from the center (r=0) to the surface of SWNT with different surface interaction potentials.