Reports: DNI554770-DNI5: Scanning Tunneling Microscopy Study of Subsurface Oxygen on Rh(111)
 printer friendly
Scientific Progress
Support from the PRF has enabled advances in understanding the formation of subsurface oxygen (Osub) on Rh(111) and Ag(111), and structures on the oxidized surfaces under conditions of high oxygen coverages. On both Ag(111) and Rh(111), the surface becomes saturated with O, but additional oxygen atoms can absorb into the selvedge of the metal, resulting in total oxygen coverages in excess of a monolayer (ML). Additionally, we have studied how the surface temperature (Ts) influences the chemical state of the oxidized Ag(111) surface. These findings have provided needed guidance to further probe the chemical and physical properties of Osub.
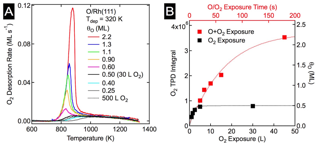
Figure 1: O uptake on Rh(111). A) TPD spectra after O2 and AO exposures. Coverages 0.5 ML an less (O2) show a broad desorption feature between 850 K and 1300 K. AO exposures resulted in O coverages in excess of 0.5 ML, and exhibited a sharp peak near 850 K. B) Plot of integrated O2 desorption and total O vs. oxygen exposure. The black squares are of O2 and the red are for AO.
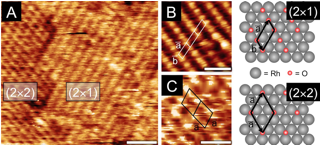
Figure 2: STM images of Rh(111) after oxygen exposures. A) θO = 1.1 ML showing low coverage (2«2)-O and (2«1)-O surface structures. B) θO = 0.6 ML detail of (2«1)-O structure and C) detail of (2«2)-O structure with θO = 1.1 ML.
For the rhodium study, a clean Rh(111) crystal was exposed to oxygen under ultra high vacuum (UHV) conditions; the oxygen coverage (θO) was measured using auger electron spectroscopy (AES), the total amount of oxygen quantified with temperature programmed desorption (TPD), and the surface structures were determined using low energy electron diffraction (LEED) and scanning tunneling microscopy (STM). O2 readily dissociates on Rh(111), and θO saturates at 0.5 ML, predominantly forming a (2«1)-O adlayer. However, small domains of the lower coverage, θO = 0.25 ML, (2«2)-O adlayers persist, even after long exposures, indicative of the asymptotic approach to 0.5 ML. Total oxygen coverages greater than 0.5 ML were achieved by dosing the Rh(111) sample with AO. As shown in Figure 1A, an 180 s exposure to AO resulted in a total O coverage of 2.2 ML. Interestingly, STM analysis (Figure 2) of the oxidized surface showed the same (2«1)-O adlayer as was found at θO = 0.5 ML; this suggested that the O in excess of 0.5 ML absorbs into the rhodium surface forming Osub.
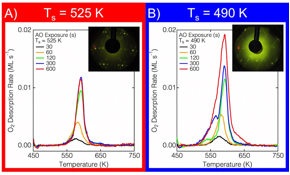
Figure 3: TPD and LEED of Ag(111) after AO exposure. A) AO exposure at Ts = 525 K. A single desorption peak (595 K) and LEED pattern observed. B) AO exposure at T2 = 490 K. In addition to desorption peak in A), a lower temperature peak grows and dominates. The LEED pattern evolves, until the striped pattern in B) emerges.
We have also studied a catalytically active surface, Ag(111), where extensive reconstruction occurs upon deposition of O atoms. We have focused on how subsurface O can be formed on Ag(111), and how the surface reconstruction structure may be perturbed when the selvedge is populated with O atoms. Ag(111) was exposed to gas-phase O atoms in UHV, and the resultant surfaces were studied with a combination of AES, TPD, LEED, and STM. Figure 3 shows TPD spectra and LEED patterns for various AO exposures (Figure 3A and B) at either Ts = 525 K (Figure 3A) or 490 K (Figure 3B). Aside for changing the surface temperature, all other parameters were unchanged. At the higher surface temperature, a single TPD peak at 600 K was observed to grow and saturate. Likewise, the LEED pattern intensified, but remained a single pattern, as the AO exposure increased. Additionally, these surface were studies with STM; post-exposure images are shown in Figure 4. With elevated temperature, Ts = 525 K, only a singles surface reconstruction, p(4«5Ã3), was observed. At short exposures (Figure 4A) the reconstruction is images as lower than the homogeneous portion (bare Ag(111)), the isolate black dots are individual O chemisorbed atoms. Alternatively, for AO exposures at lower temperatures, the surface exhibits several co-existing surface reconstructions, but as the O coverage increases past 0.50 ML, a single, striped surface structure was observed (Figure 4D). The total amount of O for various exposures is shown in Figure 5 for several different Ts.
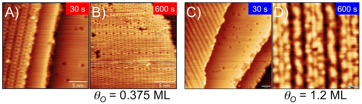
Figure 4: STM images of oxidized Ag(111) after AO exposure at Ts = 525 K for A) 30 s and B) 600 s; C) and D) are images taken after 30 s and 600 s AO exposures at Ts = 490 K, respectively. The STM images agree with the LEED images in Figure 3; at higher temperature, the p(4«5Ã3) structure dominates, while a striped pattern is formed at 490 K.
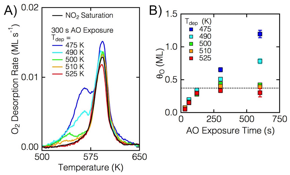
Figure 5: A) TPD spectra for 300 s AO exposures at several different Ts, as well as for NO2, which yields only Oad (black trace) at θO = 0.375 ML. B) Total oxygen coverages after AO exposures; the saturation at 0.375 ML is evident for all Ts > 500 K.
Finally, we studied a couple of different systems. We imaged sub-monolayer coverages of D2O on stepped Pt(553) and confirmed a theoretical prediction that water molecules would form tetragonal structures across the monoatomic Pt step. We also studied low temperature dissociation of O2 on Pt(553) and found that the resultant surface structure is the same for O2 exposures at 450 K or 100 K, confirming that surfaces with (110) step geometries can dissociate O2 at 100 K.
Career and Student Impacts
Support from the ACS PRF has been essential for a total of six original research publications. On supported student graduated with his PhD in March 2016, and a large portion of his experimental results were obtained with PRF support. A second supported student won an AVS poster award in September 2015, and has given several other presentations about her work on the ACS PRF project. Finally, three undergraduate researchers have also been supported and their research experiences have been invaluable for their career aspirations.