Reports: DNI254849-DNI2: Hydrosulfurization of Dissolved Organic Matter in Sediments - Linking Sulfate Reduction and Dissolved Organic Sulfur Formation
 printer friendly
All proposed experiments have been completed and samples have been and will continue to be analyzed. Analysis that have been completed include the determination of optical properties (UV-Vis, Fluorescence), DOC, sulfate and sulfide concentrations. The analysis of solid-phase extracted DOM using ultrahigh resolution mass spectrometry have also been undertaken, but data mining will continue. Thus far, PI Gonsior, PhD student Jenna Luek and undergraduate student Kaitlyn Thompson conducted all experiments and analysis mentioned above.
Freshwater sediments were collected upstream of Conowingo Dam on the Susquehanna River and incubated in a Coy Glove Bag to maintain anaerobic conditions. Varying concentrations of sodium sulfate and sodium acetate were added to six triplicate sediment sets, corresponding to a salinity gradient of 0, 0.5, 1, 5, 10, and 15.
Samples were incubated in 250 mL Schott glass bottles and kept in the dark. Each sample (a total of 18) contained a slurry of 150 g anaerobic sediment and 200 mL Milli-Q water that was boiled and purged with nitrogen several times to prior to addition to the sediment samples. Slurry samples were allowed to rest for one week before the addition of sodium sulfate and sodium acetate.
After 0, 1, 3, and 5 weeks, 20 mL water samples were taken and filtered through 0.7 mm Whatman GF/F glass fiber filters. From this, 5 mL filtered water was used to quantify sulfate concentrations by ion chromatography in order to evaluate how much sulfate was utilized and how much was present at the time of sampling. Measurements from this sub-sampling also included DOC, EEM fluorescence, and absorbance. All samples were stored in amber glass vials and at -18°C until further analyses were performed.
Additionally, after weeks 0 and 5, 50 mL samples were solid-phase extracted for FT-ICR-MS analysis. This method was performed using a modification of a previously described solid-phase extraction procedure (Dittmar et al., 2008). Briefly, all samples were filtered (0.7 mm Whatman GF/F) then acidified to pH 2 using oxygen-free formic acid (high purity grade) in order to protonate organic acids and to increase the extraction efficiency to about 60% carbon. The samples were then solid-phase extracted to desalt and concentrate the sample to be able to undertake MS analyses.
Sulfate concentrations were measured using ion chromatography, Excitation emission matrix (EEM) fluorescence and UV-Vis absorbance measurements of filtered DOM samples were measured using the Jobin Yvon Aqualog fluorescence spectrometer. All SPE samples were analyzed using a Bruker Solarix 12 Tesla FT-ICR-MS located at the Helmholtz Zentrum Munich, Germany in March 2016.
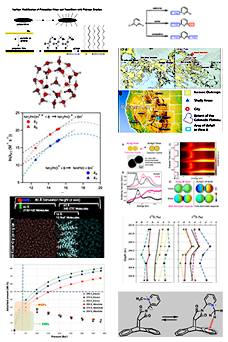
Results showed a consistent utilization of sulfate by sulfate reducing bacteria (SRB) (Fig. 1), but very little sulfide production, suggesting that sulfide is almost quantitatively scavenged by presumably metals such as iron.
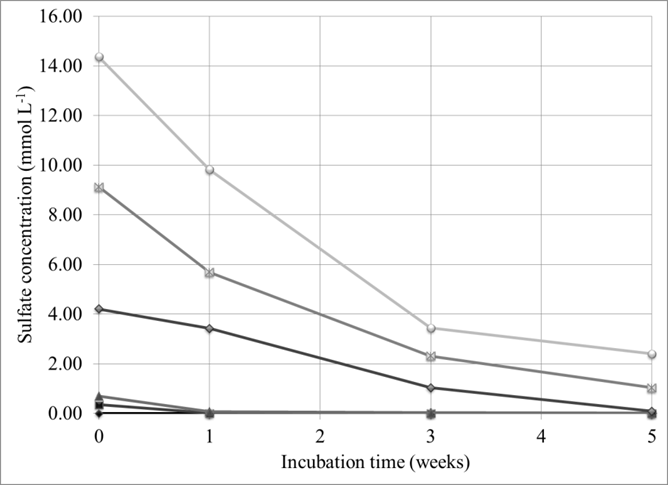
Figure 1: Sulfate utilization by sulfate reducing bacteria at different initial sulfate concentrations. Note: acetate was added stoichiometrically to supply sufficient labile carbon.
Added iron in the third set of experiments did not affect the sulfate reduction and resulted in similarly low hydrogen sulfide concentrations supporting the hypothesis that metals such as iron were already present in high enough concentrations to scavenge hydrogen sulfide. Unfortunately, this seems to be the reason why S34-labeled sulfate was not found to be incorporated into the DOM based on preliminary FT-ICR-MS results. We will continue to process a tremendous amount of information supplied by this technique. It also appeared that at highest sulfate concentration (equivalent to salinity 15) did produce some presumably sulfur-containing compounds that started to be visible against the very complex DOM background (Fig. 2), but labeled-sulfate could not be used at this high concentration due to costs. At this stage, the m/z peaks appear to contain sulfur due to the appearance of the sulfur isotopologues, but exact molecular formulas based on C, H, O, N and S could not be assigned. We are still trying to figure what the exact formulas are of a suite of about 100 molecular ions.
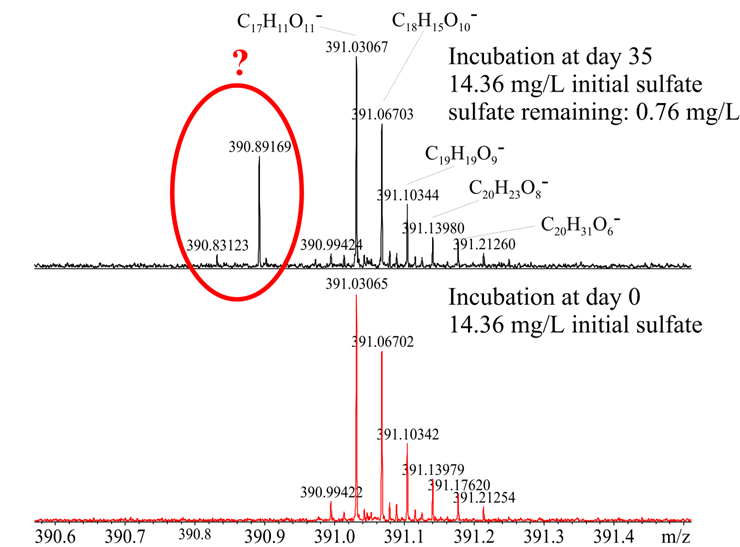
Figure 2: Ultrahigh resolution mass spectra at nominal mass 291 before and after 35 days of anaerobic incubation
We will continue to design experiments that may be successful in tracking labeled-sulfate, but that would require to reallocate funds within the grant.
A very surprising result was a direct relationship between sulfate reduction rates and the increase in fluorescent DOM (FDOM) (Fig. 3).

Figure 3: Excitation Emission Matrix fluorescence before and after 35 days of anaerobic incubation of lake sediments and an initial sulfate concentration of 14.36 mg/L. Note: sulfate concentration at day 35 was 0.76 mg/L.
We also modeled the fluorescent using parallel factor analysis (PARAFAC) to determine different statistical components in the fluorescence data (Fig. 4).
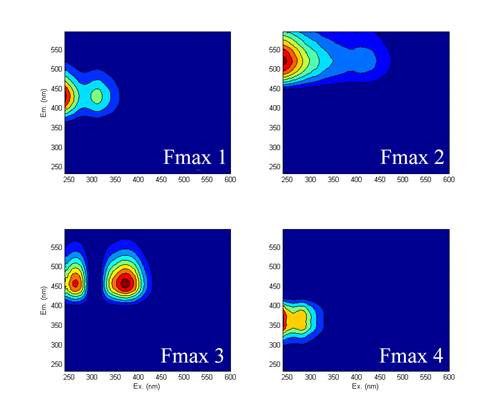

Figure 4: Correlations between PARAFAC components and sulfate utilization
Results revealed 4 components that all showed strong correlations with sulfate reduction rates, which indicated that they were originating from the same source but also that they might have been either released at different rates or some transformations of the chromophores occurred.
To further investigate if sulfate reducing bacteria were solely responsible for the humic-like FDOM, we conducted an experiment were all conditions were kept the same except that no sulfate was added. The high amount of acetate (also added to samples containing sulfate) supported fermenting bacteria, but no increase in fluorescent DOM was found. Similarly, the blanks (sediment + water only) did not show a change in FDOM either. These results highly suggested that a direct metabolite of SRBs was responsible for this FDOM signal. We will continue to investigate what this metabolite might be. We will undertake NMR measurements and will try to use FT-ICR-MS data in a semi-quantitative way to determine which molecular signatures increased over time and hence which m/z signals negatively correlated with sulfate reduction rates and positively with FDOM.
Results from these experiments will be part of Kaitlyn Thompson Bachelor thesis. A poster was presented at the ACS meeting in Philadelphia August 2016 by Kaitlyn Thompson and Jenna Luek.