Reports: DNI553696-DNI5: Dynamics of the Dissolution of Carbon Dioxide (CO2) Bubbles in Flow and the Formation of Clay-Covered CO2 Emulsions
 printer friendly
Through the support from the ACS PRF award in 2016, the PI has reported an approach to stabilize carbon dioxide (CO2) gas bubbles encapsulated in micrometer diameter aqueous drops when water in the aqueous drops is evaporated. Double emulsion drops are generated using microfluidic approaches and evaporation is conducted in the presence of sodium dodecyl sulfate (SDS), poly(vinyl alcohol) (PVA) and/or graphene oxide (GO) particles dispersed in the aqueous phase. We examine the roles of the bubble-to-drop size ratio, PVA and GO concentration in the stabilization of CO2 bubbles and show that thin shell particles with encapsulated CO2 bubbles can be obtained under optimized conditions. The developed approach offers a new strategy to study CO2 dissolution and stability on the microscale and the synthesis of novel gas-core microparticles. The supported research also significantly helps to build up my career in the field of emulsions and emulsion-based functional materials, and train graduate students.
In the presence of SDS, the size of CO2 bubbles decreased quickly inside the microfluidic channel and reached a constant size after being collected outside the microfluidic device. When the aqueous phase was allowed to evaporate for 120 min at room temperature, the size ratio (d0/D0) between bubbles (d0) and drops (D0) started to play a role. The percentage of drops with the highest size ratio (d0/D0 = 0.55) decreased the fastest and the drops with a mid-range size ratio (e.g., d0/D0 = 0.46) had slightly better performance than the drops with the two other size ratios at the end of evaporation (Fig. 1). We then showed that the observed phenomena are due to an interfacial instability at the early stage of evaporation and the effect of a solid shell at the late stage of evaporation. When PAV was added to the aqueous phase, the percentage of drops with encapsulated bubbles increased significantly after evaporation and increased with the increase of PVA concentration. This observation held true for all three different bubble-to-drop size ratios (Fig. 2). Because the bulk viscosity of drops increased due to the addition of PVA, the increased interfacial area of drops upon water evaporation could be presented as folding or deformation of the interface instead of explosion. As a result, CO2 bubbles in PVA-containing drops were expected to be more stable than those in PVA-free drops.
When GO particles were added in the aqueous phase, we showed that 94% of drops still contained CO2 bubbles after 120 min of evaporation (Fig. 3). In comparison, the highest percentage of drops with encapsulated CO2 bubbles was 81% when GO was absent in the aqueous drops. Remarkably, hollow particles with a relatively thin shell around CO2 bubbles were formed and some of the particles exhibited a hexagonal shape (Fig. 4). Adding filler particles such as GO into polymer matrices can control the stress distribution in the polymer matrix, transfer applied stress from the matrix to the particle, and thus increase the strength of the polymer matrix. As a result, the mechanical stress arising from the expansion of bubbles upon evaporation was likely distributed evenly on the PVA-GO composite, resulting in a shell with a relatively homogeneous thickness. Indeed, the calculated threshold buckling pressure (97.9 kPa) based on the shell theory is consistent with a recently reported value of 95.8 kPa in a poly (DL-lactic-co-glycolic)acid (PLGA) shell with encapsulated CO2 gas. Thus, a relatively large capillary pressure will be needed to deform the shell, which explained the observed smooth surface of the particles. The developed approach thus provides new insights into the stability of CO2 bubbles and paves a new way to produce gas-core particles, which are known to have many applications in a wide range of fields.
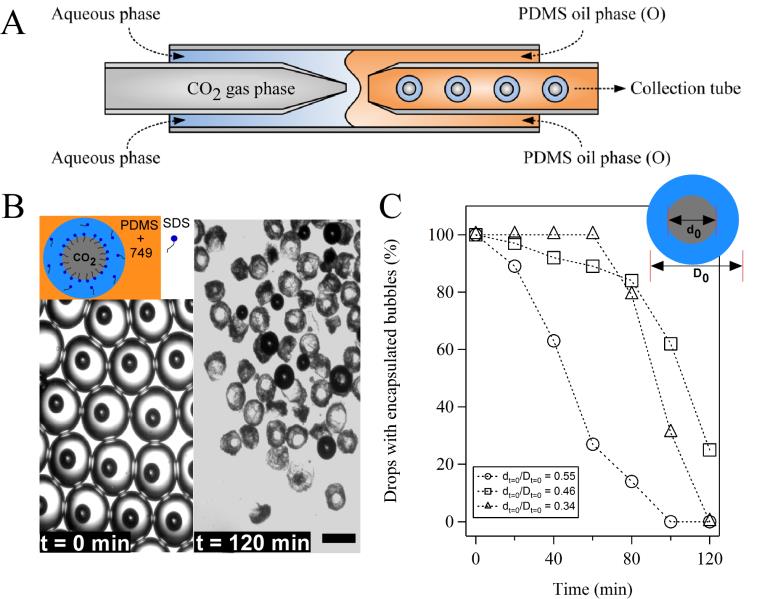
Fig. 1 Microfluidic generation of CO2-in-water-in-oil double emulsion drops and the stability of encapsulated CO2 microbubbles upon water evaporation. (A) Schematic of the microfluidic setup for the generation of CO2-in-water-in-oil drops. (B) Typical images of the drops with encapsulated CO2 microbubbles before and after evaporation at room temperature. Scale bar: 200 µm. Inset: schematic of a CO2-in-water-in-oil drop in the presence of SDS. (C) The change of percentages of CO2-containing drops with evaporation time at different initial bubble-to-drop diameter ratios. dt=0 and Dt=0 are, respectively, the diameters of bubble and drop (shown in inset) when they were collected outside the microfluidic device.
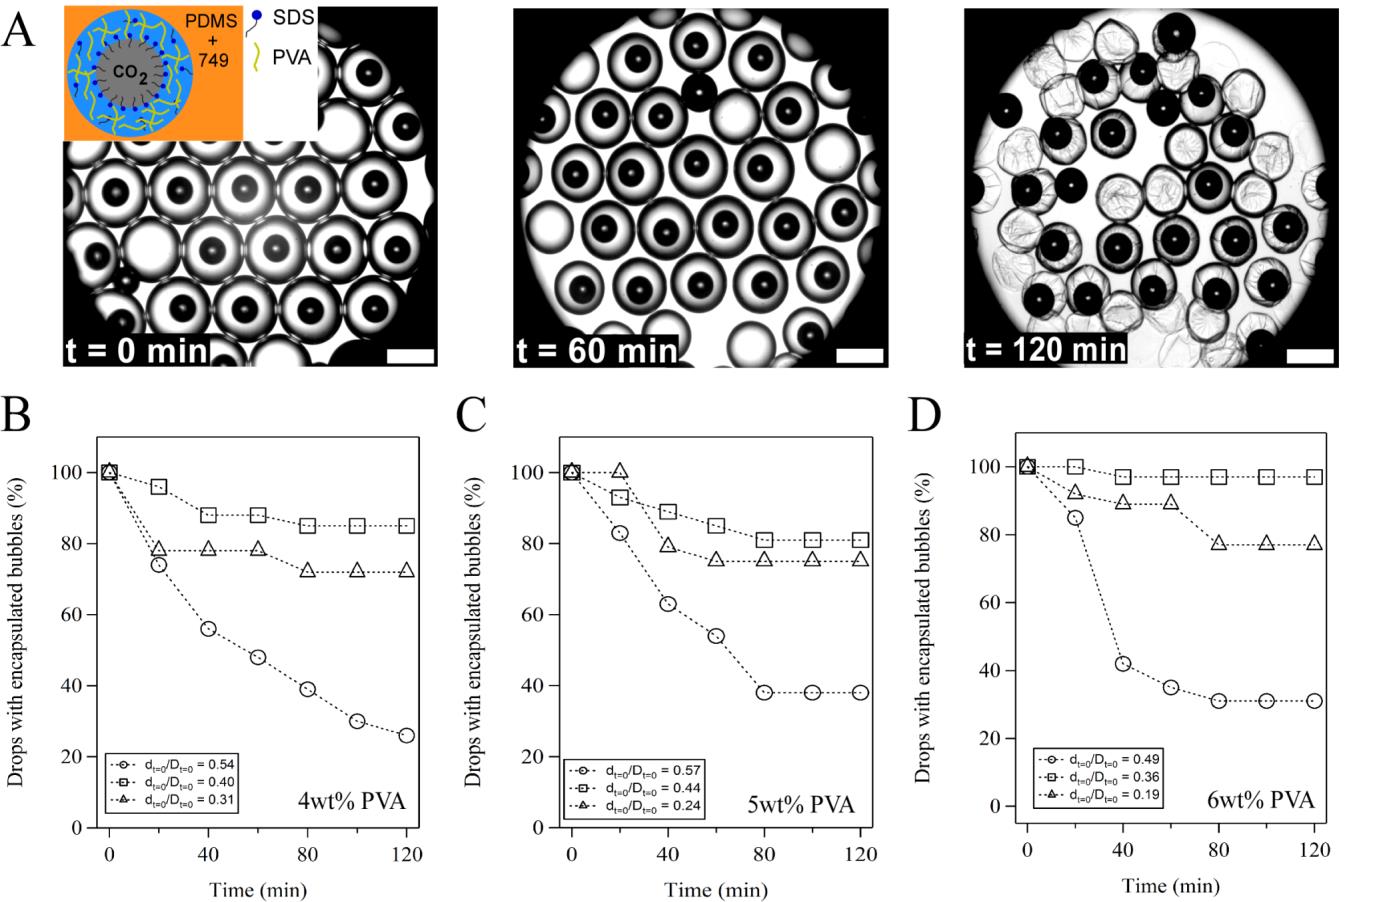
Fig. 2 Effect of PVA
on the stability of CO2 microbubbles upon water evaporation. (A)
Images of drops with encapsulated CO2 microbubbles at different time
of evaporation. Inset: schematic of a CO2-in-water-in-oil drop in
the presence of SDS and PVA. Scale bar: 400 µm. Change of percentages of CO2-containing
drops with evaporation time at different initial bubble-to-drop diameter ratios
in the presence of (B) 4 wt%, (C) 5 wt% and (D) 6 wt% PVA.

Fig. 3 Effect of GO on
the stability of CO2 microbubbles encapsulated in aqueous drops in
the absence of PVA. (A) and (B) are, respectively, the
change of percentages of CO2-containing drops with evaporation time
with and without PVA. (C) and (D) are, respectively, the microscopic image of
drops with encapsulated CO2 microbubbles after evaporation (t= 120
min) at dt=0/Dt=0 = 0.53 and dt=0/Dt=0 = 0.38. Inset:
schematic of a CO2-in-water-in-oil drop in the presence of SDS and
GO. Scale bar: 500 µm.
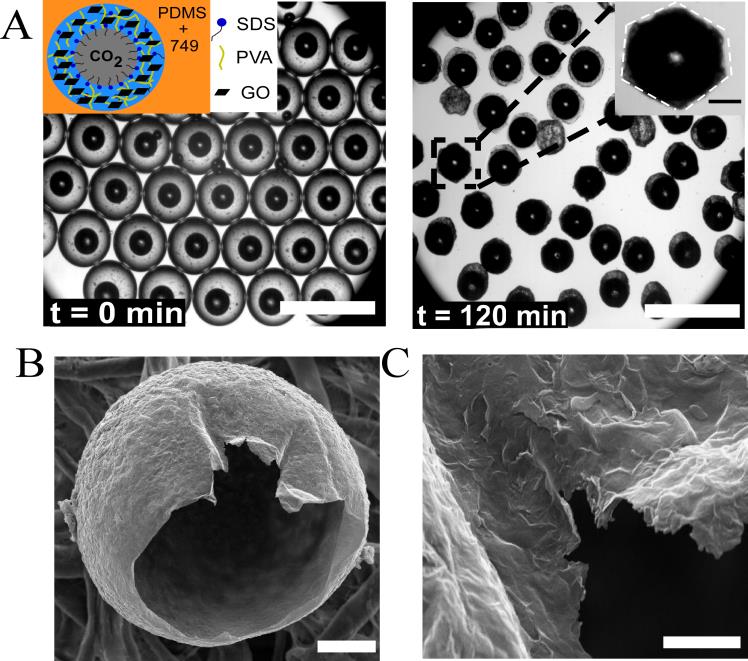
Fig. 4 Evaporation-induced formation of hollow particles in the presence of GO. (A) Images of drops with encapsulated CO2 microbubbles before and after evaporation at room temperature. Inset: schematic of a CO2-in-water-in-oil drop in the presence of SDS, PVA and GO. Scale bar: 700 µm. Inset: microscopic image of a particle with hexagonal morphology. Scale bar: 100 µm. (B) SEM image of a single hollow particle. Scale bar: 50 µm. (C) High magnification SEM image of the shell. Scale bar: 5 µm.