Reports: ND852282-ND8: Relationships of Primary Sedimentary Facies to Physical and Chemical Properties of the Marcellus Shale in Central New York State
 printer friendly
Compositional data and facies analysis are commonly employed to evaluate organic-rich mudstones within both the academia and industry. For the Union Springs Formation (Marcellus Subgroup) of New York, three vertical columns of rock properties were characterized using high resolution petrography, compositional data from XRF and TOC analyses, and gamma ray emissions.
Within less than the 3.2 m to 3.9 m thickness that constitutes the entire formation, fifteen microfacies comprise three broad lithofacies groups at locations spanning 38.6 km distance. The petrographically defined lithofacies and microfacies reflect primarily high-order environmental variability, and secondarily diagenetic variability. Basin-scale changes related to eustasy and tectonic subsidence were major controls on broad facies trends, but much more variability exists at a regional and local scale. Within each vertical column, carbonaceous mudstones show variation with respect to primary silt composition, bedding character, pyrite abundance, cementation, organic matter morphology and enrichment, and fossil type and abundance. In the near field (hundreds of meters scale), vertical microfacies patterns are laterally similar except for the degree of bioturbation. At that length scale, variability is largely diagenetic, expressed by variable calcite concretion position and texture, secondary organic enrichment due to hydrocarbon migration, and cementation after partial compaction. Far field heterogeneity is somewhat more significant, and is typified by differences in the depositional environment, including ecological factors expressed by fossil assemblages, energy of tractive currents expressed by shell deposits, silt abundance and composition, and bacterial activity just below the sediment-water interface expressed by concretions. There was also far field heterogeneity induced by variation in the magnitude of compaction. The environmental differences arose from factors including differing water column oxygenation (and possibly water depth) during deposition of the Limestone lithofacies group, and slight differences in near sea-bed water velocity. Overall, whereas short distance variations are most readily ascribed to biological activity, the variations at scales of tens of kilometers reflect a combination of physical environmental processes as well as spatially diverse biological systems.
X-ray fluorescence and LECO organic carbon analyses of samples from each microfacies in the Marcellus subgroup columns probe inter-facies and intra-facies variability. Utilization of well-established paleo-redox proxies sheds light on times of likely oxic to suboxic paleodepositional conditions (Figure 2, <80 cm above base), intermittent oxygen deprivation (Figure 2, ~330 cm above base), and established anoxia or euxinia (Figure 2, ~120 cm above base).
Lithofacies groups, comprised of microfacies, are compositionally distinct from one another, but identifying sources of intra-facies variability requires petrographic examination. Most microfacies display a compositional signal matching the mineralogic signals identified in thin section. However, major and trace element abundances are not constant between microfacies even within individual facies groups, and intrafacies variability is not uniform, with specific facies displaying more and others less compositional variability. Geochemical variability within microfacies strongly correlates to depositional features such as bedding character, but also reflects diagenetic features such as cementation.
Gamma ray measurements along one of the quarry wall columns (Figure 3) show a pattern of rising gamma signal moving upward from the limestones below the Union Springs Formation to roughly 1 m above the formation base, and then a gradual decline. Typically the three compositional sources of high gamma emissions in the Marcellus Subgroup are clays, organic matter, and silt-sized potassium feldspar. Although gamma ray maxima are commonly credited to be flooding surfaces driven by transgression, the maximum here exists at a height nearly 10% of the formation thickness above the maximum flooding surface identified with microfacies criteria. This displacement reflects the system balances in the distal portion of the basin, where at times of maximum transgression almost no siliciclastic sediment was received and therefore volumes of clay or feldspar are minimum. Rather, reworked pelagic carbonates with thin organic-rich interbeds and bone beds accumulated in this distal position during the time of maximum transgression. Although those organic-rich interbeds are expected to have a high gamma ray signal, their <3 cm thickness means that their high gamma-ray signature is muted within the surrounding strata of limestones, which produce very low levels of gamma radiation. Instead, in this location the maximum gamma values correspond to a geologically-brief regressive period which produced a higher flux of clay and silt. In addition, the gamma emission maximum is likely influenced by the high organic carbon content within adjacent strata that have common veins composed of a solid hydrocarbon. These veins marked migration of hydrocarbons and secondary enrichment of pyrobitumen, rather than a depositional facies.
Overall, assessments of paleoenvironments, resource potential, and mechanical behavior all improve through combination of multiple methods to identify primary microfacies, diagenetic zones, and compositional trends.
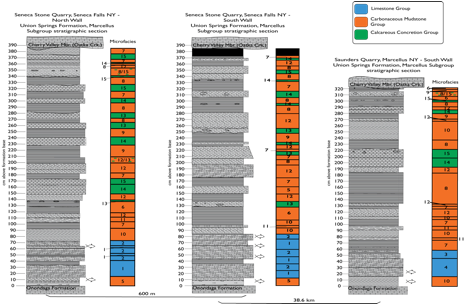
Figure 1. Three stratigraphic sections of the Union Springs Formation, for locations spaced 600 m and nearly 39 km apart. Lithofacies designations indicated by colors, and microfacies by numbers. Vertical axis is height above the base of the formation, in centimeters (Mason, 2016).
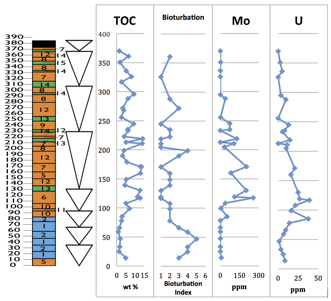
Figure 2: Microfacies positions at the South wall of study area at Seneca Stone Quarry (Seneca Falls, NY) alongside identified parasequences (see Figure 3 caption), total organic carbon (TOC) content, bioturbation and redox-sensitive trace element abundances (Molybdenum, Uranium). Vertical axes in centimeters above base of Union Springs Formation (Mason, 2016).
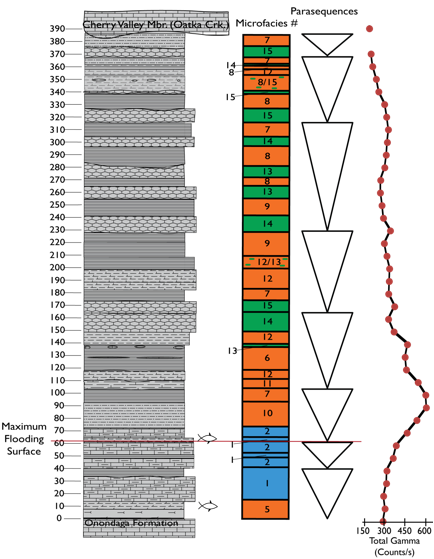
Figure 3. Stratigraphic section of Union Springs Formation described at the north wall of the Seneca Stone Quarry in Seneca Falls, NY. Microfacies (numbers), parasequences (triangles are widest in strata with most regressive microfacies and narrowest in most transgressive microfacies), and gamma ray log. Fish symbols indicate bone-rich horizons. Vertical axis is height above the base of the formation in centimeters (Mason, 2016).