Reports: DNI251357-DNI2: Basin-Scale Chronostratigraphic Subsurface Correlation Using Isotopic Analysis of Well Cuttings and Cores
 printer friendly
The ability to understand petroleum formation, migration, and reservoir development in complex sedimentary packages requires having a 3D spatial and temporal framework of the depositional environment. During this two-years of our PRF funding (2011-2013), we have worked to demonstrate the utility of carbon isotope chemostratigraphy as a robust means of basin-scale correlation in the subsurface. This work formed the basis for the Ph.D. thesis of graduate student J. Garrecht Metzger (anticipated graduation May 2014) and supported the training of several undergraduates working in the lab. Specifically, we have focused on developing a new framework for correlation of Late Ordovician-aged strata spanning the Black River, Trenton Limestone, and Utica Shale across the subsurface of New York State. This isotopic framework was constructed using the stratigraphic variation in the isotopic composition of carbonate carbon (d13Ccarb) data from well cuttings and cores to generate chronostratigraphic logs (Fig. 1). These logs can be used to effectively correlate wells on a basin-wide scale, including across lithologies (e.g., between limestone and shale). We have emphasized the use of cuttings, as these are routinely collected during drilling and can provide the maximum lateral resolution for subsurface correlation.
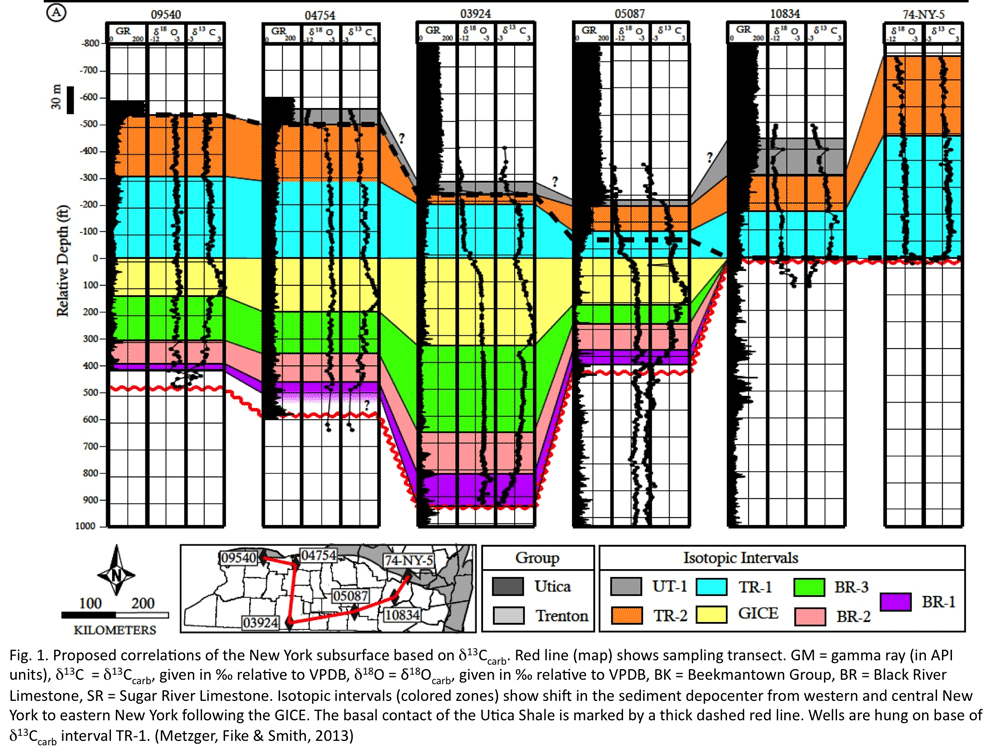
We have been able to use our chemostratigraphic data from well cuttings to identify six isotopically distinct packages of time-equivalent strata (Fig. 1) within the Black River, Trenton Limestone, and Utica shale (Metzger, Fike & Smith, 2013). These isotopically defined intervals cut across lithologic boundaries, highlighting the time-transgressive nature of lithologic contacts. For example, paired chemostratigraphic and lithostratigraphic data document the time-transgressive nature of the base of the Utica Shale, which is deposited later moving farther to the west across New York State. Using these isotopic data we have been able to establish novel correlations in the subsurface of New York that were not previously possible using conventional lithostratigraphic and geophysical methods.
In addition to generating a baseline framework of isotopic variability, we have also worked to investigate the impact of sampling frequency and sample selection has on the resulting chemostratigraphic logs (Fig. 2). Parallel geochemical (percent carbonate and total organic carbon) and isotopic (d18Ocarb and d13Corg) data were collected alongside d13Ccarb in order to understand the origin of stratigraphic and spatial variability in the d13Ccarb signal and screen for diagenetic alteration that can obscure chemostratigraphic correlations (Fig. 3).
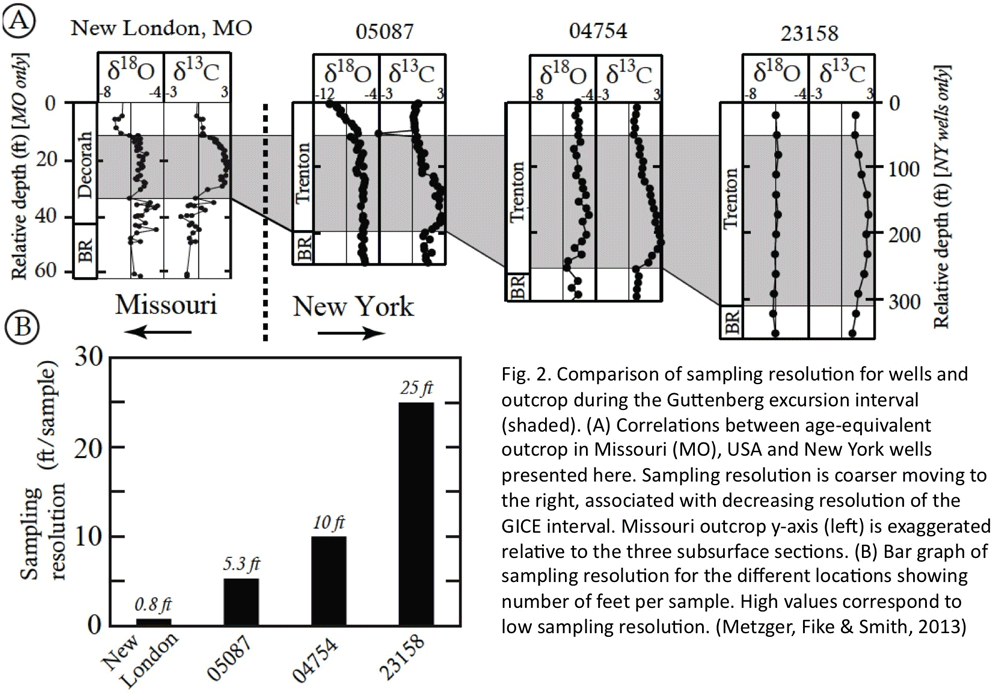
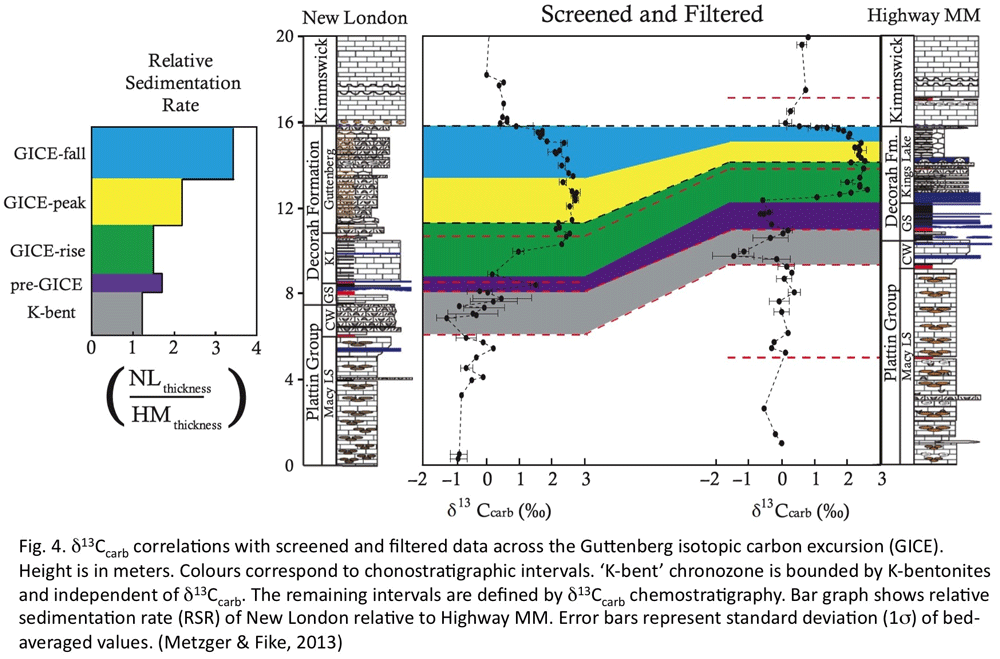
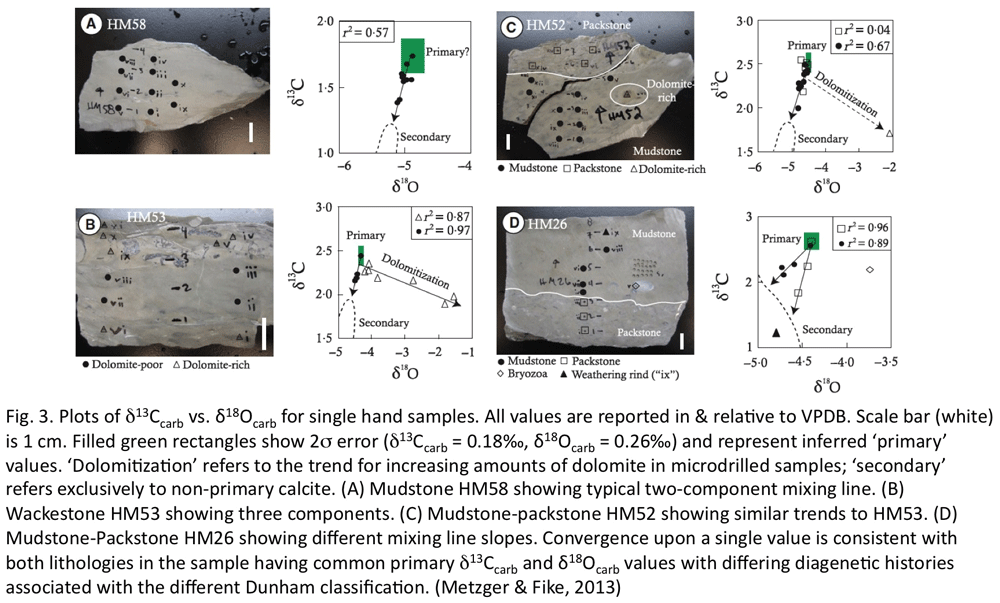
One of our isotopically defined intervals spans the Guttenberg carbon isotope excursion, a +2.5permil increase in the record of d13Ccarb that had been observed at multiple localities around the world. Previous researchers have suggested that the magnitude of this excursion and the baseline d13Ccarb composition of the strata both vary as a function of geographic location. Such geographic variability would pose significant challenges for regional isotope-based correlations. To better understand spatial gradients in the isotopic composition of carbonate carbon (d13Ccarb) during the Guttenberg excursion, we investigated the isotopic variability at this time in numerous sections spanning the Appalachian basin and the Midcontinent. In particular, to supplement the aforementioned work in the subsurface of New York, we investigated the magnitude, spatial scale, and sources of isotopic variability of the Guttenberg excursion in two sections from Missouri, USA. Centimeter-scale isotope transects revealed variations in d13Ccarb and d18Ocarb greater than 2ä across individual beds. However, rather than reflecting primary spatial gradients in isotopic composition (i.e., originating within the water column), our petrographic and elemental abundance data, together with linear d13Ccarb–d18Ocarb mixing lines, demonstrate that much of the isotopic scatter in single beds was due to the mixing of isotopically distinct components (Fig. 3).
These observations allowed us to develop objective sample screening to determine the 'least-altered' data. The resulting 'least-altered' d13Ccarb profile that we have generated improves the understanding of regional as well as continental-scale stratigraphic relationships in this interval (Fig. 4). Correlations with other Laurentian sections strongly suggest that (1) small-scale variability in Guttenberg excursion d13Ccarb values may result in part from local diagenetic overprinting, (2) peak-Guttenberg excursion d13Ccarb values of the Midcontinent are not distinct from their Taconic equivalents, (3) no primary continental-scale spatial gradient in d13Ccarb (e.g., arising from "aquafacies") is required during Guttenberg excursion-time. This study demonstrates the importance of detailed petrographic and geochemical screening of samples to be used for d13Ccarb chemostratigraphy. The results were published this year in Sedimentology (Metzger & Fike, 2013). The resulting d13Ccarb stratigraphic profiles obtained from geochemically and petrographically screened samples record basinal- to global-scale patterns in d13Ccarb variability and are thus suitable for use in subsurface correlations to improve our understanding of basin evolution.
Finally, strata deposited within this time interval include several bentonites that contain zircons suitable for uranium-lead dating. Ongoing work is focused on dating several of these ashes that span our isotopically defined stratigraphic units. This will provide absolute age constraints that will enable us to independently evaluate our chemostratigraphic correlation framework.