Reports: DNI949744-DNI9: Effect of Polymer and Polymer Gel on Disproportionate Permeability Reduction to Gas and Water for Tight Gas
 printer friendly
Background
Polymers and polymer gels have been widely used to control excess water production in conventional hydrocarbon production assets. Water/oil or water/gas flows in porous media are strongly modified in the presence of polymers or polymer gels on the pore. So the polymers or polymer gels are often called relative permeability modifier (RPM). However, previous experiments on RPM were mostly focused on conventional rocks without fractures. The conduits for fluid flow in tight and shale gas reservoirs are primarily the natural fractures which have high permeability but low porosity. However, there is no published literature to report to what extent that polymer can reduce water permeability more than to gas permeability in fractured flow path.
Objectives
The overall objective of this project is to advance the fundamental science and the in-depth understanding of disproportionate permeability reduction mechanisms of polymer to gas and water in tight gas. Using this knowledge, we can design new relative permeability reduction agents that will lead to maximize the disproportionate permeability reduction (DPR) effect of relative permeability modifier (RPM) to gas and water in tight gas reservoirs during gas production. Applications from these study results would provide information towards the implementation of the novel concepts on RPM as well as improve results of mitigating excess water production from tight gas and shale gas reservoirs.
Capillary Model
Fused-silica square capillary is used to function as sample fracture for monitoring fluid flow behavior as shown in Figure 1. 80 cm long capillaries (Polymicro, 53-μm i.d., 374-μm o.d.) are used while a HPAM polymer (SNF, Flopaam 3630s, 1000 ppm) is selected. High purity nitrogen gas is used as target gas phase. High accuracy gas regulator is used to control gas injection pressure while various gas mass flow meters (Omega Engineering) with different ranges are applied to measure the gas flow rate in the capillary. Pressure transducers are used to measure the pressure drop in the capillary.
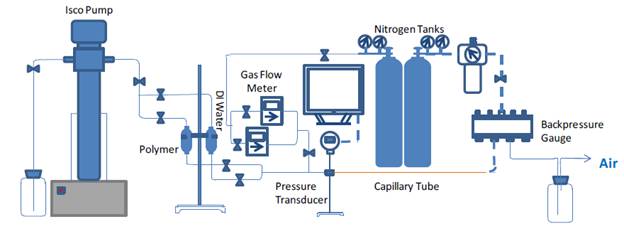
Figure 1. Capillary Experimental Setup
The resulting permeability reduction to water due to polymer adsorption can be determined using the ratio of the pressure drops in the capillary obtained at the same brine injection flow rate before and after polymer injection.
Gas injection before and after polymer treatment was performed to evaluate the gas permeability changes. Klinkenberg effects were used to evaluate the gas intrinsic permeability in the capillary at low mean pressure. Three groups of tests were performed to ensure the accuracy of the measurements.
Figure 2 shows the results on permeability changes to water and gas in capillary tubes. The permeability reduction is decreasing with the increase of water injection rates. Reduction of water permeability varies from 1.4 to 2.0 depending on different injection rates. However, polymer injection increases but not decreases gas permeability. Polymer adsorption is generally considered the dominant polymer retention mechanism causing DPR effect. Polymer layers can restrict the water/gas flow after the polymer treatment. At the mean time, improved surface profile due to adsorbed polymer layer can also promote smoother fluid flow. More studies will be performed to fully understand the mechanism of the polymer DPR effect on capillary tubes using optical microscope and electronic scanning microscope.
Results on permeability changes to water and gas in capillary tubes confirm the DPR effect of polymer for gas/water flow. Reduction of water permeability is larger than gas permeability reduction (slightly improved gas permeability). It means the relative permeability modifier could reduce the water permeability without changing the gas flow in the micro channels.
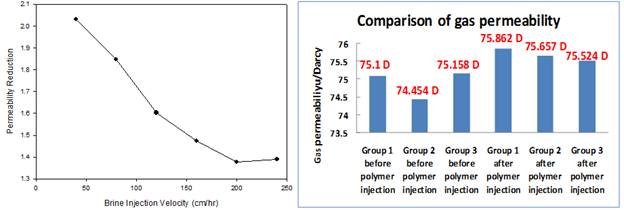
Figure 2. Permeability Changes to Water and Gas in Capillary Tubes
Fractured Tight Gas Sands Model
Tight gas sands cores (1 inch in diameter and 2 inches in length) from Changqing field in the Ordos basin of China are used in this study. The experimental setup is similar to the capillary model. Controlled fracture widths are created by using stainless steel shims with known shim thickness (50-100 µm) between two equal core halves split along the axle of the core as shown in Figure 3. The original rock permeability is 0.613 md and porosity is 12.3%. The fractured rock model is fitted into a Hassler type core holder and 400 psi confining pressure is applied.
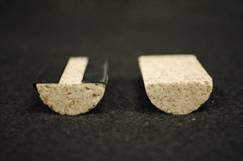
Figure 3. Fractured Tight Sand Model
Figure 4 shows the results on permeability changes to water and gas in fractured tight sands models with 100-µm shim thickness. The permeability reduction is decreasing with the increase of water injection rates. The reduction of water permeability varies from 1.06 to 1.2 depending on different injection rates. According to the gas permeability equation, gas permeability reduction can be determined by the following equation:
Rkg=(DPg2Pm)after(DPg2Pm)before
The reduction of gas permeability varies from 1.13 to 1.17 depending on different gas flow rates. It means polymer can reduce both water and gas flow in fractured tight gas sands systems. It is different with the results in capillary models which indicate slightly improved gas permeability. One possible explanation is the difference between capillary model and fractured rock model. Capillary model is the simplest models which only consider the fluid flow in the fracture/conduit. So the permeability measured is the fracture permeability. For the fractured rock models, fluid can transport from both the fracture and the rock. So the permeability measured is the effective permeability for the whole fractured rock system. Polymer injection can block the rock surface and form a layer of polymer cake which prevents the fluids to go through the rock. Even though the fracture gas permeability can be slightly improved, the rock permeability will be greatly reduced which can lead to the overall effective gas permeability reduction for the fractured rock model.
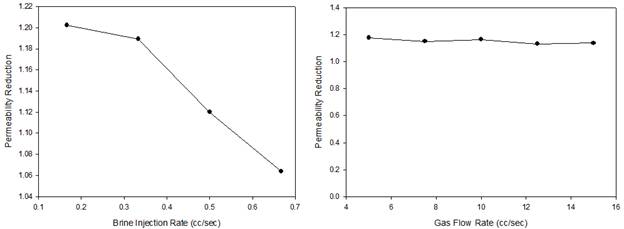
Figure 4. Permeability Changes to Water and Gas in Capillary Tubes
Future Work
1. Test the extent of polymer effect using fractured shale rocks and compare the results with the current capillary model and fractured tight sands model results.
2. Study the DPR mechanism of the polymer effect to gas and water flow using micro models under confocal microscope and electronic scanning microscope.