Reports: ND951836-ND9: Multiscale Modelling of the Interface of Model Crude Oils with Water
 printer friendly
Oil water interfaces have a wide variety of important applications ranging from the understanding of oil spills to enhanced oil recovery. As crude oil is a highly complex mixture it is informative to use well controlled model mixtures to address this problem in detail. Currently we focus on the lighter components of crude. The most abundant light components are alkanes and aromatics. As these types of molecules are strongly different in their polarity it is not surprising that there is evidence for interface induced sorting such that the aromatics localize closer to the water phase than the aliphatics. Crude oil has therefore also significantly lower surface tension than pure alkanes of the same density. We are studying in this project currently this effect in detail and for the first time calculate the ensuing surface tension using a detailed molecular model.
Simulation Details
We have performed detailed Molecular Dynamics simulations with the Gromacs 4.5 package and the CHARMM27 force—field under NpT conditions. The molecules are arranged in slab geometry (Fig1. Bottom), i.e. we have a flat oil water interface. The current model systems contain heptane as prototype alkane and toluene as aromatic. We also calculated free energies of transfer between different phases by pulling molecules from one phase to another integrating the force along the coordinate.
Tab 1. Surface tensions measured using different techniques in our simulations. sI is the surface tension via integrating the pressure profile, sA via averaging the pressure tensor.
# Heptane | # Toluene | # Water | sI [mN/m] | sA [mN/m] |
500 | 694 | 8449 | 42.35 | 42.37 |
444 | 750 | 7241 | 44.43 | 42.13 |
1194 | 0 | 8469 | 48.12 | 51.90 |
0 | 1250 | 7974 | 40.73 | 36.97 |
We find that the surface tension of the mixed systems are between the pure systems but they are closer to pure toluene which again indicates that the actual interface to water is enriched in toluene.
Calculation of Pressure Profiles and Surface Tension
Simulations can measure local pressure distributions and pressure profiles. By measuring the pressure profile across the interface we determine the surface tension between phases as well as subphases just by integration of the difference of the lateral and normal pressure profiles across the interface.

Fig 1. Top: The stress profile across the interface. We show the raw data and smoothed data to clarify the important feature of the interface. We clearly see an asymmetry at the interface. On the oil side the rise is much less steep than on the water side indicating a less sharp interface, which may be a double interface with accumulation of toluene at the water. Bottom: Visualization of the slab geometry, Oxygen is red, Hydrogen white and Carbon blue.
The density profiles show clearly an enrichment of toluene at the interface indicating that there is a free energy minimum of toluene right at the interface. However, we cannot determine the free energies from the density profiles directly as the probability of oil entering the water phase is too low to register in our finite simulations. Therefore we resort to pulling simulations where one oil molecule is pulled through the interface. We expect that for toluene we find a free energy minimum at the interface whereas for alkanes we do not expect this but have a simple interface. Also the free energy of transfer from the oil phase to the water phase should be lower for toluene due to its higher polarity.
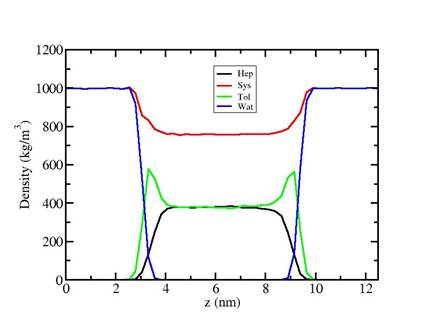
Fig 2: Density Profile of a heptane/toluene/water system
Free energy calculations
Based on the configurations available from the MD simulations we can also determine directly the free energy at a surface. In order to calculate free energies in a simulation a variety of techniques can be used. We use the umbrella sampling technique where a particle is fixed in a certain region of space by an additional external potential. A wide range of simulations with overlapping regions of spatial fixation (different external potentials) are then being performed to determine the free energy landscape along a particular path (e.g. from the water across the interface into the oil), i.e. we pull the particle across the interface. The many simulations have to be jointly analyzed to obtain the correct free energies. If we pull a heptane molecule from the mixture to the water we find a single interface without any minimum and a free energy of transfer of about 8 kcal/mol. This is consistent with our expectation. Pulling a toluene molecule shows a weak minimum at the interface and a second minimum in the middle of the oil. There is a slight maximum about 1 nm from the interface which speaks for weak enhancement of alkanes there.
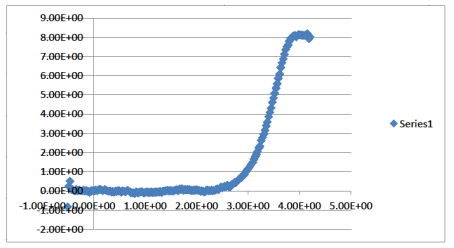
Fig 3: Potential of Mean Force of a heptane molecule across the interfaces between water and a toluene-heptane model oil. There is no minimum at the interface indicating a simple interface for alkanes.
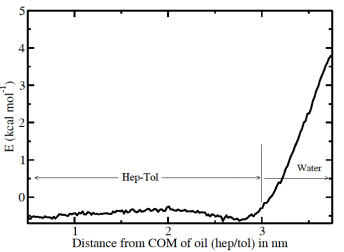
Fig 4: Potential of Mean Force of a toluene molecule across the interfaces between water and atoluene-heptane model oil. There is a weak minimum at the interface indicating slight enrichment at the interface for aromatics.
These results are currently prepared for publication.