Reports: DNI851157-DNI8: Rock-Physics and Seismic Modeling of the Haynesville Shale
 printer friendly
The goal of this project is to relate seismic P- and S-wave velocity to distributions of reservoir properties of interest (i.e., porosity, composition, and pore shape) for the Haynesville Shale. Rock-physics modeling and seismic inversion establish the relationships, which can be used to improve predictions of economic drilling locations. These relationships are non-unique, uncertain, and scale dependent. At the core and well log scales, the Haynesville exhibits anisotropy from horizontal layering and aligned inclusions, which requires anisotropic rock-physics modeling. The complex geometry of real grains and pores at the micro-scale control the elastic properties, and we approximate those geometries with idealized shapes within an effective medium model. Distributions of minerals, pore shapes, micro-cracks, and fluids are combined within the model to represent trends between the measured elastic and reservoir property data. Statistical treatment of the reservoir properties provides distributions for assessment of the ambiguity in the elastic response. These distributions and the associated uncertainty are related quantitatively to 3D seismic data.
Results
Figure 1a shows P-wave, S-wave, density, composition, and porosity data from the Haynesville Shale. These well data were used to calibrate the anisotropic rock-physics model as a function of composition, porosity, and pore shape. Figures 1b and 1c show the well data (points) and the rock physics models (color). Overall, the model explains well the trends in the data.
Each seismic velocity corresponds to multiple combinations of reservoir properties. We use the information in the rock-physics model to obtain distributions of the three reservoir properties for each data point. An objective function defines the acceptance criteria based on small ranges of P-wave and S-wave velocities. Evaluating this function for each point results in distributions of the reservoir properties as a function of depth (Figure 2). Figure 2a contains the measured porosity curve (green), the probability of porosity (gray shading), and the most likely value (magenta). The mean and standard deviations of the measured and most likely values are quite similar. In Figure 2b, the probability of the aspect ratio is plotted in gray and the most likely value in magenta. Figure 2c shows the most likely composition. This successful inversion of elastic properties for the reservoir properties at the well log scale was a prerequisite for applying the inversion at the larger seismic scale.
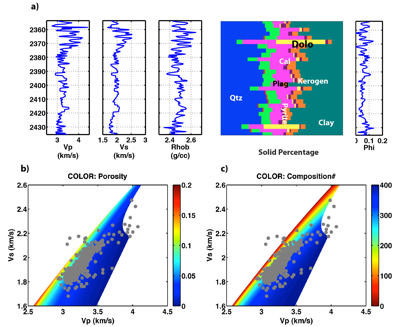
Figure 1. Well log data (a) used to calibrate the anisotropic rock physics model shown in b) and c). The model is in color, and the points correspond to the well data.
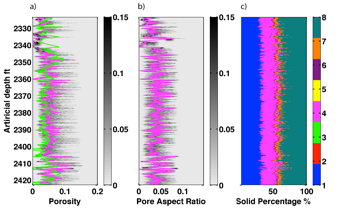
Figure 2. Inversion results at the well location and at the well log scale. Porosity (left) and composition (right) estimates closely match the measurements. Pore shape distribution estimates (center) resemble distributions obtained from micro-scale images.
Figure 3a contains seismic amplitude information for a small subset of a 3D seismic data volume. The top and bottom of the Haynesville are indicated at the well location. The variability of the amplitudes (negative values, red) within the Haynesville most likely results from variations in the porosity, composition, and pore shape. Inversion of the amplitude data for P-wave impedance (b) shows relatively low impedances (red) and lateral variability. Similar to the approach in Figure 2, one value of impedance corresponds to multiple combinations of the rock properties. Accordingly, we invert these seismic-scale impedances for distributions of the rock properties.
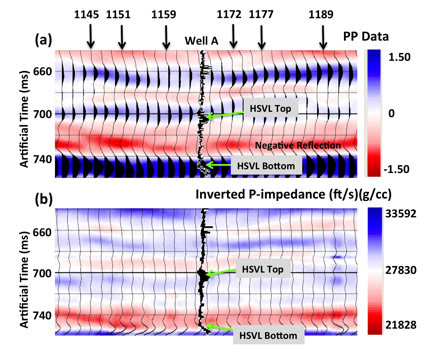
Figure 3. Seismic amplitude (a) with the well location shown in the middle. Data from that well is displayed in Figure 1. The top and bottom of the Haynesville is indicated. Panel b contains the P-wave impedance obtained by inverting the seismic amplitude data in (a).
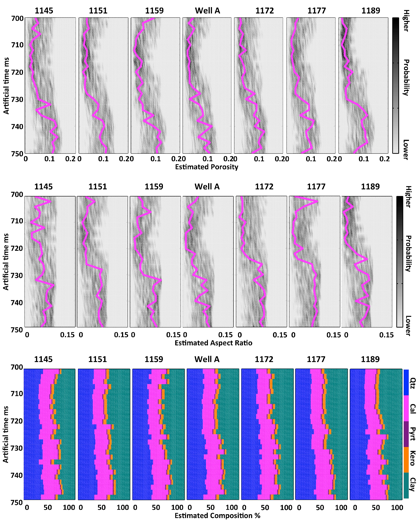
Figure 4. Seismic amplitude (a) with the well location shown in the middle. Data from that well is displayed in Figure 1. The top and bottom of the Haynesville is indicated. Panel b contains the P-wave impedance obtained by inverting the seismic amplitude data in (a).
Figure 4 contains probabilistic estimates of porosity (top row), pore shape (middle row), and composition (bottom row) for the seven traces indicated by arrows in Figure 3. These results are confined within the Haynesville unit. Porosity results show a general increase for greater times. Pore aspect ratios increase, as does calcite content, with a drop in clay content. Resolution is the primary difference between the well-log scale property estimates (Figure 2) versus the seismic-scale results (Figure 4). At the well-log scale, property estimates are obtained at every 0.15 m. Seismic estimates are obtained every 2 milliseconds, a much coarser resolution, at the seismic scale.
Conclusions and future work
Constructing various geologic scenarios in the rock physics modeling indicated the variability of the seismic velocities due to changes in rock properties. Estimates of the rock properties were extracted from the seismic data along with the associated uncertainty. Therefore, this work was successful in terms of extracting distributions of rock properties from 3D seismic data in the Haynesville Shale. A remaining step is a complete assessment of the uncertainty.
This work focused on geologic reservoir characterization of the Haynesville Shale from geophysical data. The link between the geologic parameters and geophysical data was a rock-physics model that provided numerical values of seismic velocities as a function of reservoir properties of interest. Economic production of hydrocarbons from low permeability mudrocks and shales requires inducing hydraulic fractures along horizontal wells to provide access for fluid-flow pathways. Optimal pathways depend on the reservoir properties, including how the rock fractures due to its composition and porosity and the duration for which the fracture remains open due to pore shapes. Locating places for these optimal pathways requires the use of seismic data to guide the mapping of appropriate rock properties away from well control. This work demonstrated how to obtain this important information for locating optimal zones from seismic data.