Reports: ND651675-ND6: Towards Spatially Resolved, Ultrafast Imaging of Individual Reduced Graphene Oxide Sheets
 printer friendly
Results:
Graphene oxide (GO) is an important precursor in the production of chemically-derived graphene. During reduction, GO's electrical conductivity and band gap change gradually. Doping and chemical functionalization are also possible, illustrating GO's immense potential in creating functional devices through control of its local hybridization. Here we show that laser-induced photolysis controllably reduces individual single-layer GO sheets. The reaction can be followed in real time through dramatic enhancements of GO's photoluminescence efficiency along with large spectral redshifts. Both are captured through movies of its reduction kinetics. Rate maps illustrate sizable spatial and temporal heterogeneities in sp2 domain growth and reveal how reduction “flows” across GO sheets. The observed heterogeneous reduction kinetics provides mechanistic insight into GO's conversion to chemically-derived graphene and highlights opportunities for overcoming its dynamic, chemical disorder.
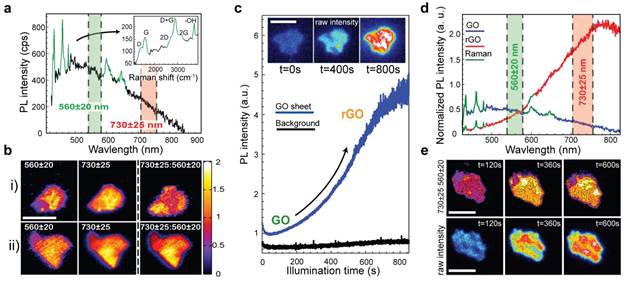
Figure 1. Emission properties of single-layer GO sheets. a, PL spectrum of a single GO sheet b, Green and red emission maps of two different GO sheets before irradiation, along with their corresponding ratio maps (730±25 nm:560±20 nm). c, PL intensity of a single GO sheet under continuous 405 nm laser irradiation. Inset: widefield raw PL intensity images of a single GO sheet after 0, 400, and 800 seconds of irradiation. d, Evolution of PL spectra before and after photoreduction. e, Ratio maps of individual GO sheets at different irradiation times constructed using the red (730±25 nm) and green (560±20 nm) portions of their PL spectra (top row). The bottom row shows corresponding widefield emission images. Scale bars: 5 µm.
On exciting samples with 405 nm light, we observe that individual GO sheets fluoresce. Namely, a broad peak, centered about ~520 nm exists, along with a tail that extends out to ~800 nm (Figure 1a). Emission maps of individual GO sheets, constructed using the ratio of their red and green PL intensities (Figure 1b), reveal significant spectral as well as spatial heterogeneities and by implicit association, the existence of sizable domain size distributions in GO. We observe that spectral heterogeneities evolve when individual GO sheets are exposed to long periods of irradiation. This is evidenced by a dramatic photobrightening of single GO sheets (Figure 1c) accompanied by a simultaneous ~270 nm redshift of the emission (Figure 1d). Analyses of ratio maps and raw intensity images reveals a continuous redshift of the emission spectrum throughout the photobrightening process. We find that predominantly red-emitting regions are the first to photobrighten/redshift (Figure 1e).
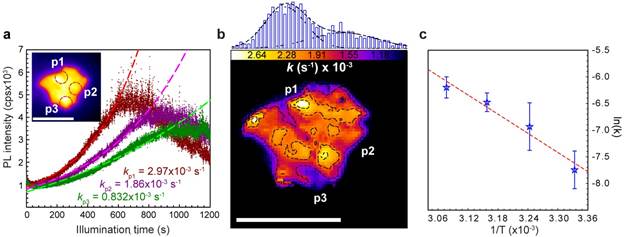
Figure 2. Heterogeneous reduction kinetics. a, Photoluminescence traces (dots) as a function of time for three different positions on a single GO sheet. Dashed lines represent corresponding exponential fits. b, Kinetic rate constant map compiled from the photolytic reduction movie of a single GO sheet, along with the corresponding k-value distribution (top). c, Arrhenius plot of GO reduction kinetics for temperatures between 298 and 323 K. Scale bars: 5 µm.
From the image sequences of GO's photolysis we extract the kinetics and heterogeneity of the underlying chemistry. Figure 2a illustrates that all brightening traces show first order kinetics and can be fit to an exponential growth relation to extract effective reduction rate constants, k. A complete spatial map of GO's heterogeneous kinetics is obtained by analyzing the photobrightening rate constant for each pixel in a reduction movie, revealing a wide variance in k-values (Figure 2b). Through the Arrhenius relationship (Figure 2c), temperature dependent rate constants are found to associate with an activation energy of Ea=0.52 eV, agreeing with theoretical migration/photolytic activation energies of OH and C-O-C functional groups. We note that prolonged illumination causes reduced GO sheets to photobleach and break apart (Figure 2a). This phenomenon is marked by episodes of intra-sheet emission intermittency that is reminiscent of quantum dot blinking and warrants further investigation in future studies.
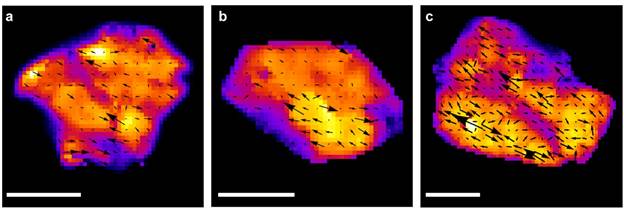
Figure 3. Single layer GO reduction dynamics. a-c, Vector field maps of the GO sheets superimposed atop their false color rate maps. Arrows show the velocity of the reduction front. Scale bars: 2.5 µm.
Photoreduction is not static; rather it is dynamic. Vector field maps of the photobrightening process graphically show how reduction “flows” across a GO sheet where velocity and magnitude of the reduction front are depicted by arrows. Figures 3a-c show representative vector maps that are superimposed on top of their corresponding rate constant maps (false color). The figure reveals that reduction always begins where the rate constant map is peaked. From this (and Figure 1e), we conclude that regions with originally large sp2 domains “seed” GO reduction. In this regard, a thermal analysis predicts that temperature differences as large as ~4 K can exist locally between reduced and unreduced regions of the GO sheet. This temperature difference can significantly enhance the observed photolytic reduction kinetics. Once reduction begins in a region with large sp2 domains, oxygen-containing functional groups nearest to these domains experience temperature changes that enhance their photolytic rates. We conclude that local temperature differences rationalize why photolytic reduction is nucleated by regions having large sp2 domains, why a rate constant heterogeneity exists within GO sheets, and why reduction spreads outwards from these nucleation points with time.
Research impact:
The research conducted under the patronage of ACS PRF has positively impacted both my career development as well the academic growth of graduate and undergraduate students who contributed to this study. Briefly, the techniques developed through this study are currently being applied to three different two-dimensional (2D) nanoscale systems. From these preliminary results, I have obtained additional funding through the Army Research Office to conduct optical/synthetic investigations into titanium disulfide and cadmium selenide nanosheets. The graduate and undergraduate students involved in this study have gained valuable knowledge and experience. In particular, a large portion of the research outlined above was conducted by an undergraduate student. Among other things, this will open up outstanding opportunities for his graduate career.