AmericanChemicalSociety.com
Reports: AC7 46752-AC7: Kinetic Control of Epoxy Morphology and Its Effect on Moisture Diffusion
Epoxy resins are a versatile class of thermosetting polymer, which are extensively used as composite matrix and structural adhesive. Although their crosslink networks are generally treated as homogeneous, a lot of evidence shows that there are nano-scale microstructures due to crosslink density variation in cured epoxy resin matrix.[1-5] Both fracture toughness and water diffusion coefficient have been shown to correlate with the microstructure of epoxy resin and hence it is desirable to be able to control the microstructure of the epoxy resin and correlate the microstructures with physical properties.
The formation of microstructure in epoxy has been proposed to follow three steps:1) Microgels nucleate and grow; 2) The microgels begin to interact, forming larger clusters; 3) At gelation the microgel particles and clusters form a continuous network with higher crosslink density, while the resin between these clusters eventually reacts to form the phase with lower crosslink density.[1] Comparing this process to the reaction-induced phase separation process in rubber modified epoxy resins, the crosslink density heterogeneity of epoxy resin should be balanced by reaction rate and phase separation speed and governed by kinetic parameters, e.g.: the reactivity of the epoxy and hardener, curing temperature relative to Tg of the resin system, and stoichiometry.[6-8]
To investigate the effect of stoichiometry and curing temperature on the microstructure of epoxy, epoxy samples with different microstructures were produced by curing diglycidyl ether of bisphenol A (DGEBA) with different diamines and different thermal histories. The curing time was set long enough to ensure the conversion was high enough so the microstructure was fixed. Samples from each formulation were cut in half and microtomed with a diamond knife to obtain a very flat surface showing the bulk epoxy. Tapping mode AFM was performed on the microtomed surfaces at room temperature in air and both topological and phase images were recorded using a NanoScope V (Digital Instruments) with a DIMENSION 3100 system.
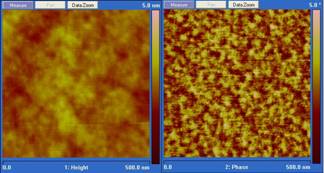
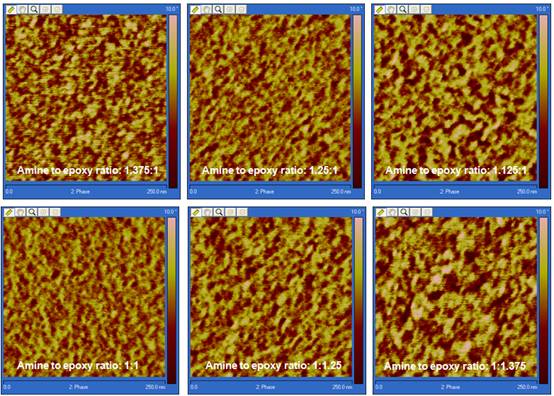
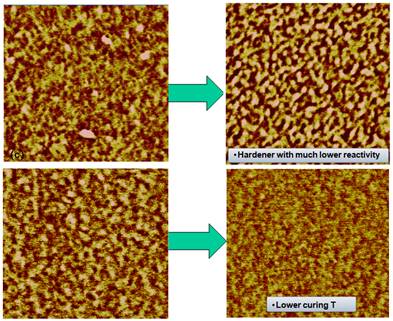
A typical height and phase AFM image of a microtomed epoxy surface is shown in Figure 1. The height image on the right shows that the microtomed surface is very flat with a height variation within 2 to 3 nm, reducing the topological effect on phase image to a minimum. In the phase image, due to the moderate tapping setting in our AFM measurement, phase contrast is related to the local viscoelasticity. In this image the brighter region is considered to be stiffer with higher crosslink density while the darker region is considered to be more viscous and has a lower crosslink density. Clearly shown in the phase image in Figure 1, cured epoxy resins have a two phase structure consisting a highly crosslinked hard phase embedded in a matrix of a soft phase with lower crosslink density. AFM phase images for other samples are similar to those in Figure 1 but with difference in the size and distribution of brighter regions due to influence from variation of kinetic parameters such as temperature, amine to epoxy functional group ratio and hardener reactivity. Figures 2 and 3 are phase images showing the morphology variation due to different curing conditions and formulas.
Figure 1. AFM height
(left) and phase (right) image of microtomed surfaces of stoichiometric DGEBA/Jeffamine
D230 mixtures cured at 140° C.
Figure 2. Morphology development of DGEBA/Jeffamine D230 mixtures as the amine to
epoxy functional group ratio was varied from 1.375 to 1/1.375.
Figure 3. Examples of morphology
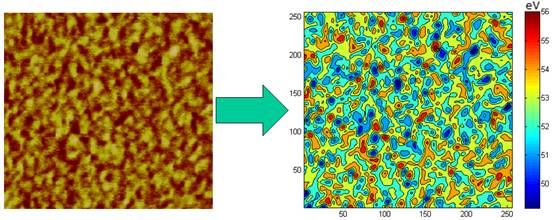
dependence on other factors The origin of the phase image is due to energy
dissipation during the AFM probe tip-sample interaction. In a phase image, the
dissipated energy Edis due to tip-sample interaction can be
calculated on each pixel, which is roughly proportional to the viscosity of the
sample on that pixel[7]. An example is shown in Figure 4 and the distribution
of Edis represents the nanoscale viscosity distribution within the
sample.
Figure 4. Color mapping of Edis calculated
from phase image. To compare nanoscale
properties between samples, the phase values in each image have to be mapped to
an absolute material property. The approach-phase-distance (APD) curve, which
was obtained by recording the phase and amplitude values while the probe was
gradually pushing the tip closer to the sample surface with a constant drive
voltage, can be used to reconstruct the tip-sample interaction forces. Reconstruction of the
tip-sample interaction was approximated by two 20 term Chebyshev polynomials[8].
Applying an appropriate contact mechanical model, which was chosen as DMT model
in this study, the modulus of the sample can be obtained from reconstructed
interaction forces. The reconstructed forces have a perfect match when using
simulated APD curves. However, this reconstruction method is very sensitive to
experimental error and noise. As a result, each APD curve used in the
reconstruction was taken as the average of ten APD curves on the same pixel and
the reconstructed result shows much improvement compared to a single APD
measurement. The method we have developed can be used in the future to map the
local property variation in these materials on a nanoscale. REFERENCES
1. Vanlandingham, M. R.;
Eduljee, R. F.; Gillespie, J. W. J. Appl.
Polymer Sci.1999, 71, 699. 2. Wu, W. L.; Bauer, B. J. Polymer 1986, 27, 169. 3. Gu, X. H.; Nguyen, T.;
Oudina, M.; Martin, D.; Kidah, B.; Jasmin, J.; Rezig, A.; Sung, L. P.; Byrd,
E.; Martin, J. W. Jct. Research 2005, 2, 547. 4. Vanlandingham, M. R.;
Eduljee, R. F.; Gillespie, J. W. J. Appl.
Polymer Sci.1999, 71, 787.
5. Kishi, H.; Naitou, T.;
Matsuda, S.; Murakami, A.; Muraji, Y.; Nakagawa, Y. J. Polymer Sci. B Polymer Phys. 2007, 45, 1425.
6. Oyanguren, P. A.; Riccardi,
C. C.; Williams, R. J. J.; Mondragon, I.
J. Polymer Sc.i B Polymer Phys. 1998,
36, 1349. 7. R. Garcia,et.al,PRL: 2006,97, 016103 8. Shuiqing Hu, et
al., Nanotechnology: 2008, 19, 375704 9. R. Garcia,et.al, Dynamic atomic force microscopy method; Surface
Science Report. 2002,47 197