Back to Table of Contents
46915-G5
In Situ Chemical Diagnostic Tribology of Dry and Lubricated Thin Film-Based Technologies
Thomas W. Scharf, University of North Texas
This
update focuses on research efforts to monitor real
time (in situ) wear, friction, and lubrication
(tribology) of solid lubricant thin films in dry and lubricated sliding
contacts. Little is known about how a liquid lubricant affects third body processes and
tribochemical (chemistry induced by sliding) reactions in situ, i.e. during sliding, especially when transitioning from a
dry to liquid contact. It is well known
that they contribute to tribological properties, but most studies are made ex situ, i.e. after the test, and
inferences are made about what occurred during the test. However, in situ optical
microscopy of the sliding interface is a more direct method for identifying
third body processes. Concomitantly,
micro Raman spectroscopy can be utilized as an in situ chemical tool to monitor tribochemical reactions and phases
that affect real time tribology.We have studied the transfer film (third body) behavior of a sapphire
slider on a tungsten-doped diamondlike (W-DLC) thin film when lubrication
changed from dry to lubricated sliding. The synthetic oil lubricant was Krytox, a
perfluoropolyether (PFPE)
fluid with applications to the petroleum industry. Figure 1 shows friction coefficients (mu)
vs. cycle curves (left: the run-in regime and right: the steady-state regime). The
“blue” curve in Figure 1 was taken with PFPE present from the beginning of
sliding and the “red” curve unlubricated.
With PFPE, mu dropped
immediately to 0.13; and, in dry air, the run-in mu remained high at ~0.6 for
about 25 cycles due to the inability to form a low friction transfer film. In
steady-state, mu in PFPE was
more than twice that in dry air, 0.13 vs.
0.05, respectively. The “black” curve
test will be discussed later.
Figure 1. Typical
friction coefficient (mu) vs. cycle curves for W-DLC thin film against sapphire
in dry air with PFPE in between, unlubricated out to 600 cycles then PFPE
added, and unlubricated. In situ visual observations (setup in Figure 2) offered new
insights into the effect of liquid lubricants on transfer film retention and tribological
behavior. A careful viewing of the images
taken during the PFPE lubricated test detected very minimal thin film wear and
no transfer film formation. Figure 2
shows representative in situ optical
images at 3, 2000, and 5000 cycles. The
oblique-pointing arrows show how the wear track width increased by 50% from cycles 3 to 2000, but hardly
changed out to cycle 5000. However some
wear debris, probably from the W-DLC thin film, were generated as shown by the ‘thicker'
arrow in Figure 2 at cycle 5000. Sliding
appears to have been sustained by the lubricant with separation distance less
than that resolvable by the Newton's
rings (≤25nm). Thus, with PFPE the velocity accommodation relied on a thin
lubrication film whereas in dry air, the velocity accommodation mode was
interfacial sliding between a transfer film and thin film (wear track). Transfer film formation in dry air was confirmed
by the in situ Raman spectra (Figure 3) taken during the test from Figure
1, “red” curve. It is evident that both
the transfer film thickened and exhibited a tribochemical reaction
during sliding since there was an increase in carbon (D and G peaks) and WO3 intensities with
increasing sliding cycles, and the unworn coating
did not exhibit a WO3 phase and the carbon G-peak
shifted to higher wavenumbers characteristic of a sliding-induced graphitic transformation.
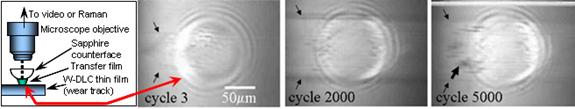
Figure 2. In
situ optical images of a sapphire counterface/W-DLC thin film interface taken
during sliding with PFPE lubricant in dry air.
The red arrow shows the position of the sliding contact at the buried
interface (sphere-on-flat geometry with Newton's
rings).
Figure 3. In
situ micro Raman spectra show an increase in carbon (D and G peaks) and WO3
intensities with increasing sliding cycles.
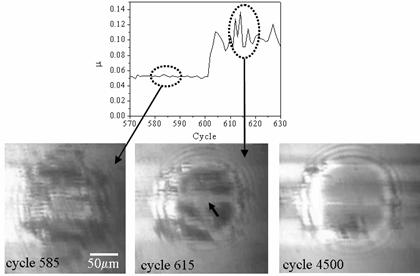
Figure
4 shows a more detailed view of the transition in mu, from the “black” curve test
shown in Figure 1 when PFPE was added at cycle 600. The friction coefficient increased
immediately from ~0.05 (cycle 600) to 0.11 (cycle 604), where it remained out
to cycle 5000. The accompanying in situ optical images at cycles 585, 615,
and 4500 show the evolution of the transfer film before and after PFPE was
added. The transfer film developed in
dry air (cycle 585) began to fall off by cycle 615 (see arrow); and with
further sliding out to 4500 cycles, most of the transfer film was lost. It is
likely that the PFPE, a low surface energy fluid, entered the film/sapphire
interface, displaced the transfer film, and then prevented third bodies from
adhering to the sapphire surface thereafter.
This suggests that liquid lubricants do not support low friction sliding
by transfer films.
Figure 4. Transition
in friction coefficient (mu) from dry to lubricated (PFPE) sliding with 3
accompanying in situ optical images of a sapphire/W-DLC thin film interface.
Back to top