Reports: DNI555581-DNI5: Descriptor-Based Molecular Design of Metal-Organic Frameworks for Catalytic C-H Activation
 printer friendly
The central theme of the project is to develop design concepts for metal-organic frameworks catalysts discovery. Due to the limited adsorption energy data on MOFs, in our preliminary studies, we used the energy gap properties for developing machine learning models. The idea and machine learning tools used here can be easily extended to reactivity properties, such as adsorption energies of critical intermediates.
The dataset for machine learning was retrieved from the Computational Materials Repository,[1] which includes >12,000 molecular structures of porphyrins and DFT-calculated properties, e.g., frontier orbital energy levels, optical gaps, and energy gaps. In this study, we focus on the energy gap calculated as the difference between the electron affinity and ionization potential, because of its importance in determining efficiencies of solar light absorption and energy transfer. By varying the side groups R1, R2, R3, and the anchor group R4 at meso-positions, peripheral substituents L at -positions, and chelating metal ions M as denoted in Fig. 1, a theoretically unlimited number of porphyrins and corresponding MOFs can be conceived and synthesized.
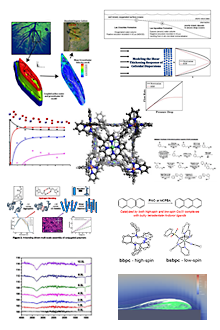
Figure 1. Structural labeling scheme of porphyrins with varying ligand substitution and metal chelation
Molecular representation, or broadly speaking feature engineering, is a key ingredient in the development of machine-learning models. The process numerically transforms the valuable information encoded in a molecular structure into a high-dimensional vector that is invariant with respect to rotations, translations and ideally has as minimal redundant information as possible. As shown in Fig. 2, four different types of molecular graph representations, i.e., molecular fingerprint, Coulomb matrix, chemoinformatics, and electrotopological-state index, are used in our study. The molecular fingerprint enumerates the fragment components in the molecular graph and maps the fragments onto a 1024-dimensional binary bit representation, where each bit indicates the presence (1) or absence (0) of a specific subgraph.[2–4] The Coulomb matrix represents a 3D molecular structure in a 2D array tabulating the strength of Coulombic interactions between atoms according to their Cartesian coordinates and nuclear charges.[5] The cheminformatics vectorizes the molecular graph's global physicochemical properties defined by its structural, electronic, and quantum-chemical characteristics.[6] The electrotopological-state index (E-state index) has been widely used in Quantitative Structure-Property Relationship (QSPR) models to predict boiling points, aqueous solubilities and other thermophysical properties of organic molecules.[7–11] The atom's E-state index encodes the unification of electronic and topological attribute information within a given chemical environment, and it is analogous to electronegativity for conceptual understanding.[12]
Figure 2. Schematics of molecular graph representations, (a) molecular fingerprint, (b) Coulomb matrix, (c) cheminformatics, and (d) electrotopological-state index.
The performance of the four molecular graph representations in predicting the energy gaps of porphyrins is evaluated by a variety of machine-learning algorithms, e.g., lasso, kernel ridge regression (KRR), support vector machine (SVM), and feed-forward artificial neural networks (ANNs). The dataset is randomly divided into 75% for training/validation and the rest 25% for test. To improve the algorithm training efficiency and interoperability, all the input features are scaled with 0 mean and the standard deviation of 1. In this work, we use the Keras library [13] for the feed-forward ANNs. The neural network architecture with 2 hidden layers and 10 neurons on each layer is determined via a cross-validation process. The training/test parity plots are shown in Fig. 3 for different features and learning algorithms. An average of RMSE errors from 16 runs is presented as one of the performance indicators, while the uncertainty of model prediction is computed by the bootstrap sampling approach [14] to provide a full description of the model performance. After taking into account all the above criteria from the RMSE, bootstrapped mean and 95% bootstrapped confidence intervals, the E-state index is identified as the best molecular graph representation for predicting the energy gaps of porphyrins. For this representations, KRR, SVM, and the feed-forward ANNs give similar model performance with RMSE <0.06 eV, while the Lasso method gave a wide-band parity plot, indicating poor model performance.
Figure 3. Parity plots for DFT-calculated vs. machine-learning model prediction of energy gaps with molecular graph representations.
In conclusion, we have developed highly accurate machine-learning models for predicting the electronic energy gaps of porphyrins, an important property for light-harvesting applications and photocatalysis. Among various molecular graph representations, the electrotopological-state index shows a robust prediction RMSE <0.06 eV with various learning algorithms, e.g., artificial neural networks. The machine-learning models developed here have potential to facilitate the design of porphyrins with appropriately aligned oxidation potentials relative to a typical I-/I3- redox couple and the conduction band of semiconductors in DSSCs, and other relevant types of materials, e.g., metal oxides, molecular complexes, and metal-organic frameworks.
Reference
[1] D. D. Landis, J. S. Hummelshøj, S. Nestorov, J. Greeley, M. Dułak, T. Bligaard, J. K. Nørskov, and K. W. Jacobsen, Computing in Science Engineering 14, 51 (2012).
[2] S. Riniker and G. A. Landrum, J. Cheminform. 5, 43 (2013).
[3] I. Muegge and P. Mukherjee, Expert Opin. Drug Discov. 11, 137 (2016).
[4] A. Cereto-Massagué, M. J. Ojeda, C. Valls, M. Mulero, S. Garcia-Vallvé, and G. Pujadas, Methods 71, 58 (2015).
[5] M. Rupp, A. Tkatchenko, K.-R. Müller, and O. A. von Lilienfeld, Phys. Rev. Lett. 108, 058301 (2012).
[6] H. Moriwaki, Y.-S. Tian, N. Kawashita, and T. Takagi, J. Cheminform. 10, 4 (2018).
[7] L. H. Hall, L. B. Kier, and L. M. Hall, in Comprehensive Medicinal Chemistry II, edited by J. B. Taylor and D. J. Triggle (Elsevier, Oxford, 2007), pp. 555–576.
[8] J. F. Contrera, E. J. Matthews, and R. Daniel Benz, Regul. Toxicol. Pharmacol. 38, 243 (2003).
[9] S. Nandi and M. C. Bagchi, Curr. Comput. Aided Drug Des. 8, 159 (2012).
[10] K. Roy and I. Mitra, Curr. Comput. Aided Drug Des. 8, 135 (2012).
[11] O. Ivanciuc, Curr. Comput. Aided Drug Des. 9, 153 (2013).
[12] L. B. Kier and L. H. Hall, Pharm. Res. 7, 801 (1990).
[13] (n.d.).
[14] T. Hastie, R. Tibshirani, and J. Friedman, The Elements of Statistical Learning: Data Mining, Inference, and Prediction (Springer Science & Business Media, 2013).