Reports: ND656894-ND6: Probing Elementary Photochemical Events in Cerium Oxide by Steady-State and Ultrafast Spectroscopy
 printer friendly
Nanoscience is a new research direction for the Kohler Group, and the students who have been supported by this project have helped to rapidly grow our abilities and expertise in this area. Graduate student Natasha Pettinger published a paper that resulted in a new collaboration to observe the nucleation and growth of CeO2 nanocrystals. Postdoc Sascha Froebel and Graduate student Jennifer Empey synthesized several new types of CeO2 nanocrystals and studied them by the transient absorption (TA) technique. Undergraduate Sangeetha Natarajan will present a poster at an undergraduate science conference later this fall. The remainder of this report summarizes technical advances made during year 1.
Synthesis and Nanoparticle Characterization
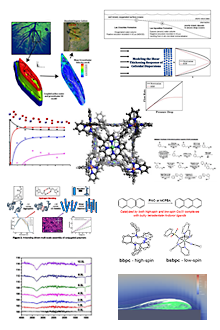
We synthesized and characterized a range of CeO2 nanoparticles (Table 1). CeO2 nanocrystals formed through hydrolysis of Cerium(IV) Ammonium Nitrate (CAN) (CeO2-CAN-AS), were characterized by High-Resolution Transmission Electron Microscopy (HR-TEM) at OSU's Center for Electron Microscopy and Analysis (CEMAS). These images reveal polydisperse nanoparticles 3 to 9 nm in diameter, with several crystallites per nanoparticle. The particles can be isolated by solvent evaporation (CeO2-CAN-D), and then added to water or alcohol to make acidic, non-turbid suspensions.
Table 1. Summary of CeO2 nanoparticle samples.
Sample
| Description
|
|
CeO2-CAN-AS
| Polycrystalline, 3-9 nm in diameter
|
|
CeO2-CAN-D
| Polycrystalline, 3-9 nm in diameter
|
|
CeO2-HMTA
| Single-crystal, crystallite size varies depending on reaction duration
|
|
CeO2-SA
| Sigma Aldrich CeO2 nanoparticles, > 25 nm in diameter, polydisperse in size and shape
|
|
Absorption characteristics
When CeO2-CAN-D nanoparticles are suspended in ethanol or tert-butyl alcohol, the solution assumes an orange-yellow color (Figure 1a). Addition of small amounts of glycerol to CeO2-CAN-D in water and CeO2-CAN-AS causes a slight red shift of the absorption onset (Figure 1b). These observations are tentatively ascribed to interfacial charge transfer from adsorbed alcohol molecules to CeO2. Our finding that the absorption spectrum depends sensitively on the adsorbate calls into question the practice of using spectral fitting to estimate the bandgap of CeO2.
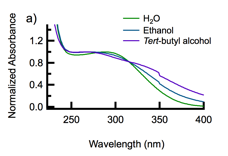
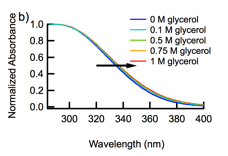
Figure 1. (a) The absorption spectra of CeO2-CAN-D suspended in water (green curve), ethanol (blue curve), and tert-butyl alcohol (purple curve) normalized to their respective absorbance maxima. (b) The absorption onset of CeO2-CAN-AS/D shifts to longer wavelengths as glycerol is added to the aqueous suspension.
Interaction with UV radiation
A major aim is to understand how oxygen vacancies alter the dynamics of photogenerated carriers. While attempting to accumulate Ce3+ defects in our nanoparticles using UV radiation, we discovered that CeO2-CAN nanocrystals undergo photoreductive dissolution with high quantum efficiency, releasing Ce3+ ions into solution (Figure 2). Photocorrosion has been observed in metal oxides like ZnO, but has not been reported previously for CeO2.
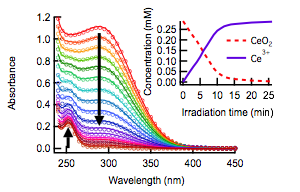
Figure 2. Absorption spectra during irradiation of CeO2 at pH 1.6 in a 1 cm cuvette (open circles). The solid lines are linear combinations of the absorption spectra of CeO2 and Ce(ClO4)3. The inset shows the concentration of each species vs. irradiation time.
Experiments are underway to determine how this process is affected by surface functionalization of the nanoparticle, pH, ionic strength, and nanoparticle morphology. We have observed that dissolution efficiency increases sharply in the presence of glycerol (Table 2). Increasing the ionic strength also leads to a modest (7%) increase in the photoreduction efficiency.
Table 2. Quantum yields at 300 nm for the photorelease of Ce3+ ions from CeO2-CAN-AS nanoparticles as a function of glycerol and NaClO4 concentration.
Glycerol conc. (M) | 1 M NaClO4 | 0 M NaClO4 |
0.0 | 10% | 3% |
0.1 | 26% | 20% |
0.5 | 33% | 26% |
0.75 | 33% | 25% |
1.0 | 34% |
|
Charge-Carrier Dynamics
We conducted broadband ultrafast TA measurements on CeO2 nanoparticles and on several nm TiO2 nanoparticles for comparison. All three ceria systems studied (CeO2-CAN-AS/D, CeO2-HMTA, and CeO2-SA) show two positive absorption bands: A stronger band with a maximum around 350 nm and a weaker band with absorption throughout the visible (Figure 3). While surface passivation and solvent dramatically affect the steady-state photochemistry, they have no effect on the TA signals in the region where there is no ground state absorption. In contrast, TA signals recorded at probe wavelengths of 320 to 450 nm, where ground state absorption is present, are shifted by a constant amount when glycerol is added but otherwise exhibit identical kinetics. Electron transfer from an adsorbed glycerol molecule appears to be very efficient with no observable back electron transfer. These results suggest that two classes of excitations are generated—surface excitations responsible for the efficient photoreduction and excitations within the bulk of the nanoparticle, which are responsible for the TA signals.
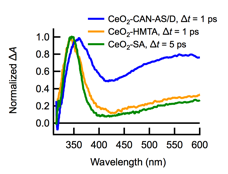
Figure 3. TA spectra of CeO2-CAN-AS/D (blue curve), CeO2-HMTA (yellow curve), and CeO2-SA (green curve) normalized to the UV-peak intensity. The pump wavelength is 320 nm.
The visible absorption band decays according to a power law, with half-lives ranging between 1.5 and 16 ps, depending on nanoparticle morphology. Generally, the positive TA signals decay more slowly for larger than for smaller crystals (Figure 4).
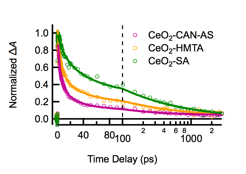
Figure 4. Kinetic traces collected from the indicated ceria samples with a probe wavelength of 600 nm following excitation at 320 nm.
Ultrafast time-resolved infrared absorption (TRIR) measurements were performed on CeO2-CAN-AS and CeO2-CAN-D nanoparticles. Direct excitation of TiO2 nanoparticles at 300 nm results in a broad positive absorption signal that decays with a half-life of 7.5 ps (Figure 5) due to free electrons in the conduction band. On the other hand, the CeO2 nanoparticle TRIR signal closely resembles the solvent signal, with a weak, quickly decaying signal around time zero. The lack of a TA signal in the IR may indicate that electrons in CeO2 trap to localized states within the laser pulse. Cerium-doped TiO2 shows an intermediate decay (Figure 5a), suggesting that conduction band electrons produced in TiO2 may trap on Ce(IV) sites and cease to absorb in the mid-IR. Our TA results suggest that electrons and holes in CeO2 are highly localized and have low mobility.
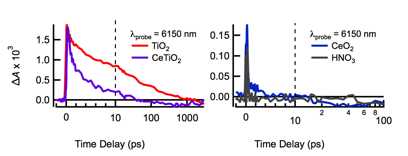
Figure 5. TRIR kinetics following excitation at 300 nm for TiO2 (red), Ce(IV)-doped TiO2 (purple), CeO2-CAN-D (blue), and nitric acid (gray) in D2O solutions.