Reports: DNI656103-DNI6: Computational Modeling of Ionic Polymers: From Solution Interpolyelectrolyte Complexes to Solid-State Membranes
 printer friendly
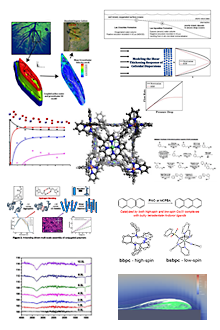
Progress 1: Structural diagram of inter-polyelectrolyte complexes (IPECs).
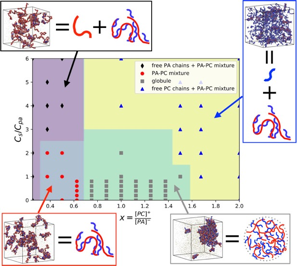
Figure 1: Structural diagram of IPECs in the plane of x (ratio of charges on PC chains to those on PA chains) and Cs (salt concentration).
We have used molecular dynamics (MD) simulations with bead-spring models of polymer chains to study the complexation of linear polycations (PCs) and polyanions (PAs) in water and obtained a structural diagram (Figure 1) of the resulting IPECs when the PC/PA charge ratio (x) and the salt concentration (Cs) are varied. Four types of IPECs are identified. For 0.7<x<1.6 and Cs<3Cpa where Cpa is the concentration of PA chains, the globule phase is found where most PA and PC chains form a large, dense cluster. For 0.3<x<0.7 and Cs<2.5Cpa, the system contains several PA-PC mixtures, each of which is a cluster consisting of multiple PA and PC chains. For x<0.3 or x<0.7 and Cs>2.5Cpa, the system has free PA chains mixed with PA-PC mixtures. For the remaining region in the x-Cs plane, free PC chains together with PA-PC mixtures are observed. Even though the IPEC structures identified in our simulations agree with those predicted by the mean-field theory of Zhang and Shklovskii [Physica A 352, 216-238 (2005)], the structural diagram is qualitatively different from the theory. For example, we have not observed the broadening of the globule phase region when Cs is increased, which is predicted by the mean-field theory. Our results reveal potential deficiency of the mean-field description of IPECs. We are currently constructing a new theory to understand these results.
Progress 2: Development of coarse-grained (CG) model of sodium polystyrene sulfonate (PSSNa) and poly([2-(methacryloyloxy)ethyl] trimethylammonium) chloride [poly(TMAEMA)].
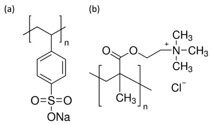
Figure 2: Chemical formulae of PSSNa and poly(TMAEMA)].
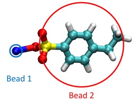
Figure 3: A demonstration of a CG model of styrene sulfonate sodium with the sodium (styrene sulfonate group) coarse grained into a positively (negatively) charged bead.
To make predictions on IPECs for realistic systems, we are developing CG models of PSSNa and poly(TMAEMA)] by grouping atoms into beads. There are two terms to describe non-bonded interactions between CG beads, i.e., the Coulomb and Lennard-Jones (LJ) potentials:
![]() ,
,
where r is the interatomic distance, qi and qj the atomic charges, εij and σij the characteristic energy and length scale of the interatomic interaction, and ε dielectric constant. Since the charges are already specified in the grouping process, the main task is to determine εij and σij so that the atomistic interactions between two atomic groups including possible polarization effects are appropriately captured. We employed the density functional theory (DFT) to fulfill this task. We map the binding energy between two atomic groups computed via DFT using the polarization continuum model to the CG potential as:
![]() .
.
Assuming rmin is the equilibrium separation between the two groups, we can determine εij and σij by this mapping. In the next step, we will examine the conformation of a single PSSNa or poly(TMAEMA)] chain to determine the parameters for the bonded interactions (bonds, angles, and dihedrals) on the corresponding CG bead-spring chain. Finally, the CG model will be used to study the complexation between PSSNa and poly(TMAEMA)].
Progress 3: Evaporation of aqueous PSSNa solutions.

Figure 4: The MARTINI-type CG model of (a) PSSNa and (b) water. (c): An aqueous solution of PSSNa with the CG model.
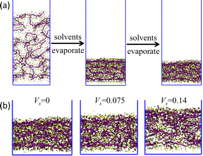
Figure 5: (a) The layered structure of the PSSNa film emerges during solvent evaporation. (b) Final PSSNa films after solvent evaporation for various initial volume fractions of the salt (Vs).
We have used a MARTINI-type model of PSSNa and a polarizable model of water (Figure 4) to simulate the evaporation of aqueous PSSNa solutions with different initial polymer volume fractions and salt concentrations. The evaporation process is modelled by removing water vapor out of the simulation box. The results show that the resulting polymer film has layered structures with alternating polymer-rich and counterion-rich regions (Figure 5a). The layering is more distinct when the initial polymer volume fractions and salt concentrations are lower (Figure 5b), while is insensitive to the evaporation rates of water as long as the rates are high enough. The layering is not observed when electrostatic interactions are turned off. Our study points to a novel one-step strategy to make layered films of polyelectrolytes via fast solvent evaporation. This paper is currently in preparation.
Progress 4: Evaporation-induced stratification of bidisperse nanoparticle solutions.
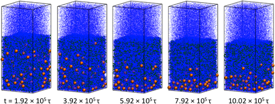
Figure 6: Snapshots of a bidisperse nanoparticle solution undergoing solvent evaporation. The system shows “small-on-top” stratification where the smaller (larger) nanoparticles accumulate in the top (bottom) half of the film.
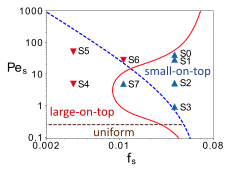
Figure 7: The state diagram predicted by the diffusion theory of Zhou et al. [Phys. Rev. Lett. 118, 108002, (2017)]. with all the eight systems we have studied. The blue dashed line is given by Pes = (ds/dl)2/fs −1 and the brown dashed line by Pes = ds/dl, where ds (dl) is the diameter of the smaller (larger) nanoparticles. The red solid line shows the sketch of the modified boundary between the “small-on-top” and “large-on-top” regimes.
Recently there are strong emerging interests in stratification phenomena in polydisperse nanoparticle solutions driven by fast solvent evaporation. However, all simulation and theoretical work so far adopt an implicit solvent model. To probe the role of solvents, we have used an explicit solvent consisting of LJ particles and simulated the evaporation of a bidisperse nanoparticle solution. Our results show that a density gradient can develop in the evaporating solvent. This gradient drives nanoparticles towards regions with higher solvent densities and strongly influences the distribution of nanoparticles in the resulting dry film. For example, we found that “small-on-top” is enhanced when the evaporation rate is reduced (Figure 6), in contrary to the prediction of the diffusion theory. As a result, the state diagram needs to be modified as shown in Figure 7. In particular, for an intermediate volume fraction of smaller nanoparticles (fs), there is a reentrant “large-on-top” regime for large values of Pes (the Peclet number of the smaller nanoparticles), where “small-on-top” is predicted by the diffusion theory. The paper based on this research is currently under review at ACS Nano.