Reports: DNI555709-DNI5: Surface Chemistry of Few Layer Hydrodesulfurization and Hydrodenitrogenation Catalysts on Sapphire Imaged by Atomic Force Microscopy
 printer friendly
Oil and natural gas supplies comprise many chemicals which must be separated prior to using the hydrocarbons as chemical feedstocks. In particular, sulfur containing molecules such as thiols and thiophenes, an nitrogen containing molecules such as amines and N-heterocycles must be removed prior to cracking long chain alkanes because they can poison the cracking catalysts. The conventional method for removing sulfur and nitrogen in petroleum feedstocks is hydrotreating reactions such as hydrodesulfurization (HDS) and hydrodenitrogenation (HDN).
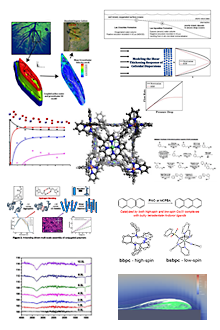
The goal of our research proposal is to study the structure and reaction pathways of MoS2 and WS2 catalysts used in this reaction. During our grant period, we encountered significant technical difficulties with our scanning probe system. We notified Dr. Lee, and focused our efforts on the synthesis of MoS2 based catalysts has made great progress. Research Aim III of our proposal is to image molecules bound to nanoplates of MoO2-MoS2. In the past twelve months, we have made significant progress in understanding how to controllably grow these interfaces. We now understand that the growth of these nanoplates is governed by the chalcogenide flux during CVD growth as shown in Figure 2. When the sulfur flux is reduced, MoO2 platelets are nucleated on the surface, and the top layers are subsequently sulfurized to form the MoS2 layers. This structure is interesting because the oxide core is metallic, providing a reservoir of electrons to be used in catalytic chemistry. Furthermore, by understanding the nucleation mechanism for these nanoparticles, we have been able to control how they interface with the underlying substrate.
We know that the growth of the nanoparticles is being controlled by the interfacial chemistry because the resulting structures are aligned along high symmetry crystallographic planes of the substrate. In both cases, we see two families of plates in scanning electron microscopy, plates that are normal to the surface, and plates that are tilted by ~35o. Each family of platelets possesses 60o rotational symmetry, and the two families are aligned at 30o relative to each other, as shown in figure 2. Furthermore the classification of two families of platelets was confirmed by locked-couple X-ray diffraction which showed only two peaks for the {010} and {001} family of MoO2 planes (figure 3).
In addition to forming MoS2/MoO2 nanoplates, we began to study other molybdenum based materials that could be converted to MoS2 for hydrodesulfurization. In particular, we began to look at the Molybdenum Telluride system. MoTe2 is a structural analogue to MoS2. The increased size of tellurium compared to sulfur increases the unit cell, which decreases the ligand field splitting of the d orbitals on the molybdenum. As a consequence, the free energy difference between the 2H (trigonal prismatic metal center) and 1T’ (distorted octahedral metal center) is small, on the order of 1-2 kBT. While different phases of MoS2 exist, the octahedral phases are much higher in energy making them chemically unstable and hard to access. Our lab was the first to report that we could control which phase of MoTe2 formed under standard CVD conditions by tuning the chalcogenide flux (figure 4). Tellurium vacancies destabilize the hexagonal, semiconducting polymorph more than the metallic octahedral phase, and so under low Te flux we could deterministically make the 1T’ phase, and under high Te flux we could grow only the 2H phase. We are now exploring the potential for different chemistry and reactivity in these two phases.
As a consequence of this increased covalency in a Mo-Te bond, we were able to make new nanostructures made from Mo and Te that cannot be made from MoS2 such as Mo(II)Te2-. In particular, we have discovered that we form a conformal surface coating of Mo6Te6 nanowires (figure 5). Individual nanowires comprise bundled strands of molybdenum octahedra with tellurium atoms bound at the edges. Typical nanowire diameters are 2-5 nm, and typical lengths 50 – 100 nm, with branching occurring roughly every 20 nm. This dense nanowire forest offers a new high surface area platform for catalytic chemistry. While we haven’t yet tested the utility of the Mo6Te6 nanowires for catalysis, we have excitingly found that we can transform them back to MoS2 while keeping the nanowire shape. This creates few layer MoS2 ribbons that are area scalable and with a high density of edges (figure 6). Most of the catalytic activity of MoS2 occurs at edges of the material, and this nanowire array has a much higher density of exposed edges than any previous morphology of MoS2.
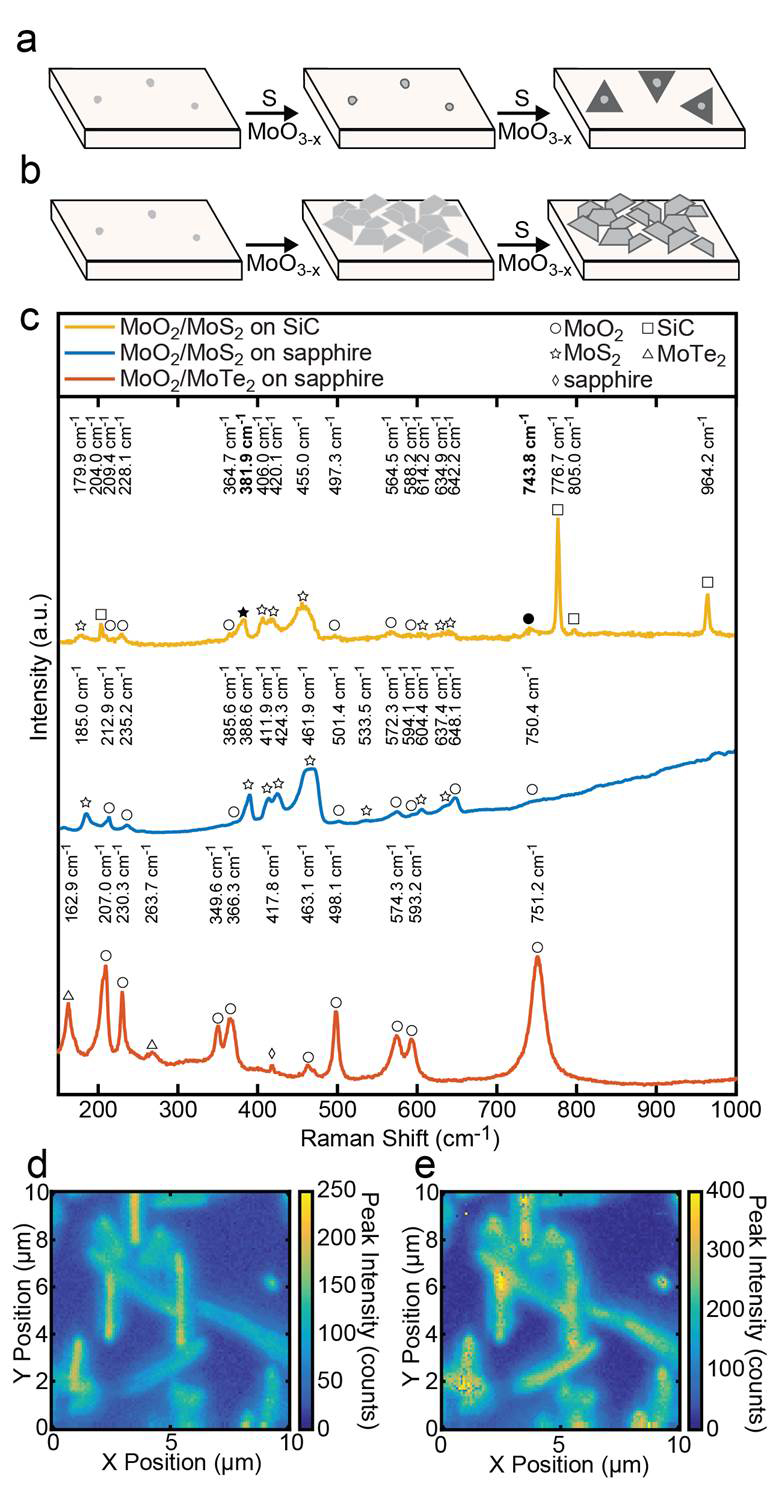
Figure 1. Schematics illustrating the self-seeding mechanisms of (a) mono-layer TMDCs (previously reported) and (b) core/shell nanoplates (reported here). (c) Raman spectra of MoO2/MoS2 core/shell plates on SiC, MoO2/MoS2 core/shell plates on sapphire, and MoO2/MoTe2 core/shell plates on sapphire with identities indicated with a symbol above each peak
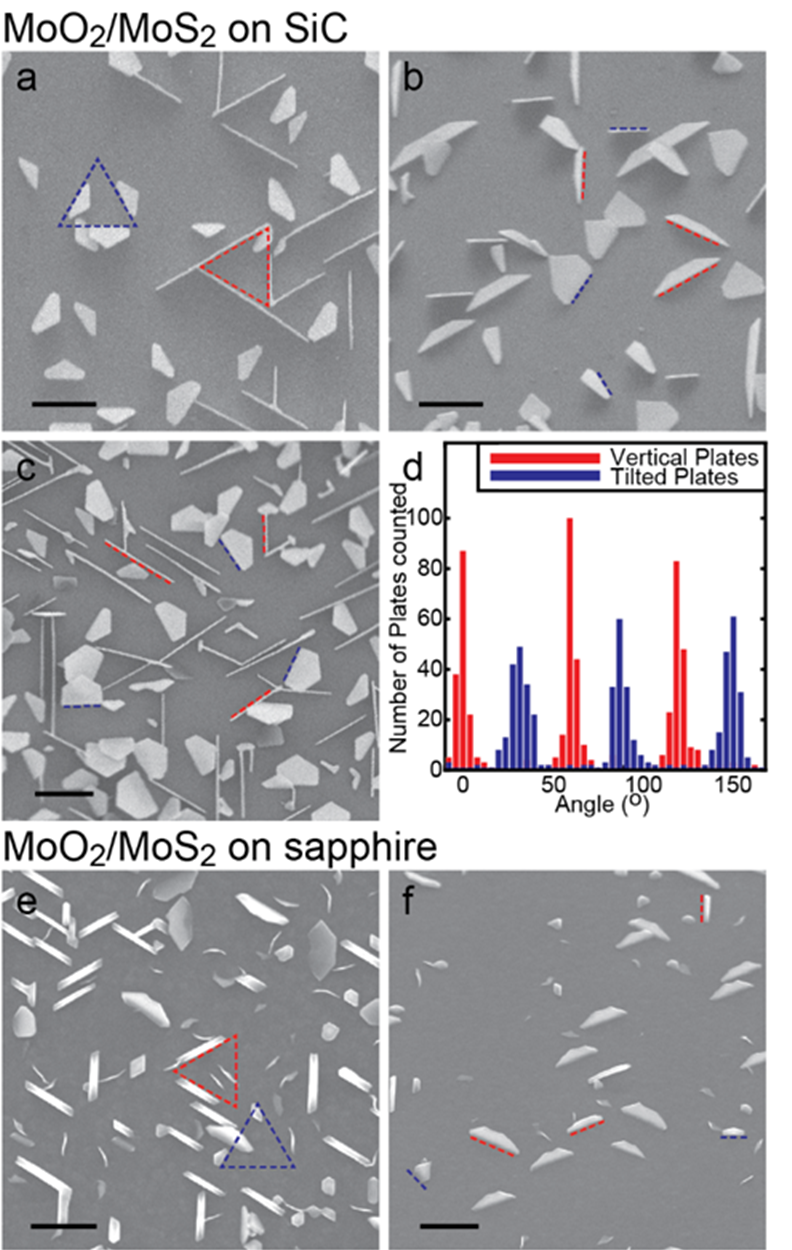
Figure 2: SEM images of MoO2 MoS2 on SiC and Sapphire substrates. Figure d: Histogram of rotational alignment of the two platelet families
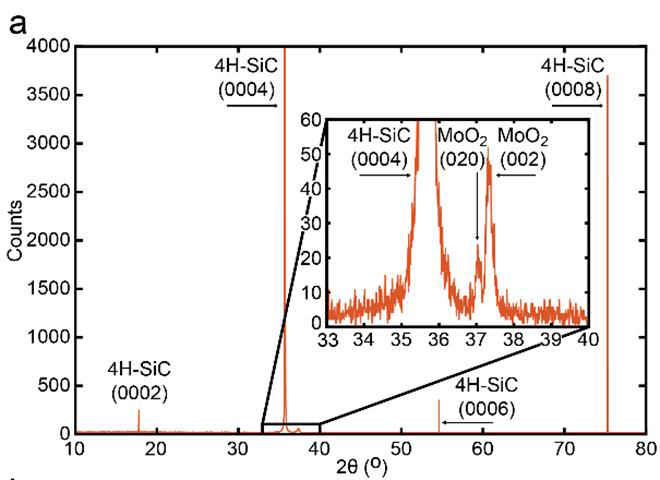
Figure 3 Lock coupled XRD scan of core/shell MoO2/MoS2on SiC(0001) showing 2 diffraction peaks.
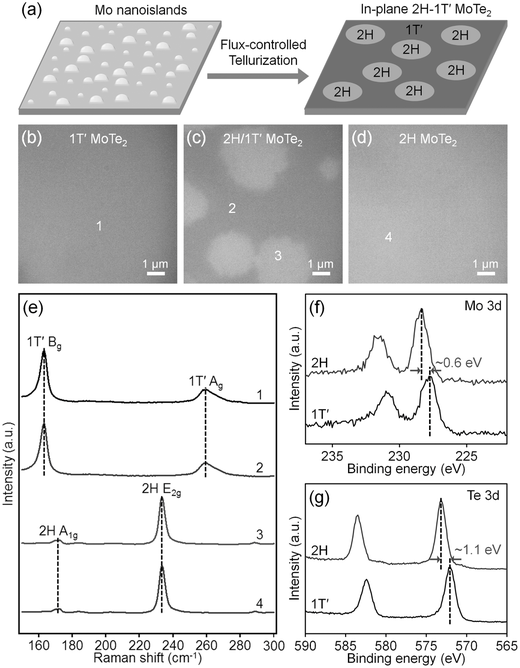
Figure 4. Growth of in-plane 2H-1T′ MoTe2 homojunctions from Mo nanoislands.
a) Schematic illustration showing the growth process. b–d)
Optical image of few-layer 2H, in-plane 2H-1T′, and 1T′ MoTe2synthesized at 635,
585, and 535 °C, respectively. e) Raman spectra taken from the points marked by
1–4 in (b)–(d). f) High-resolution XPS spectra showing Mo 3d peaks of few-layer
2H and 1T′ MoTe2. g) High-resolution XPS spectra showing Te
3d peaks of few-layer 2H and 1T′ MoTe2. The Mo 3d and Te 3d peaks of few-layer 1T′ MoTe2 are
downshifted by ≈0.6 and ≈1.1 eV, respectively, compared to those of
few-layer 2H MoTe2.
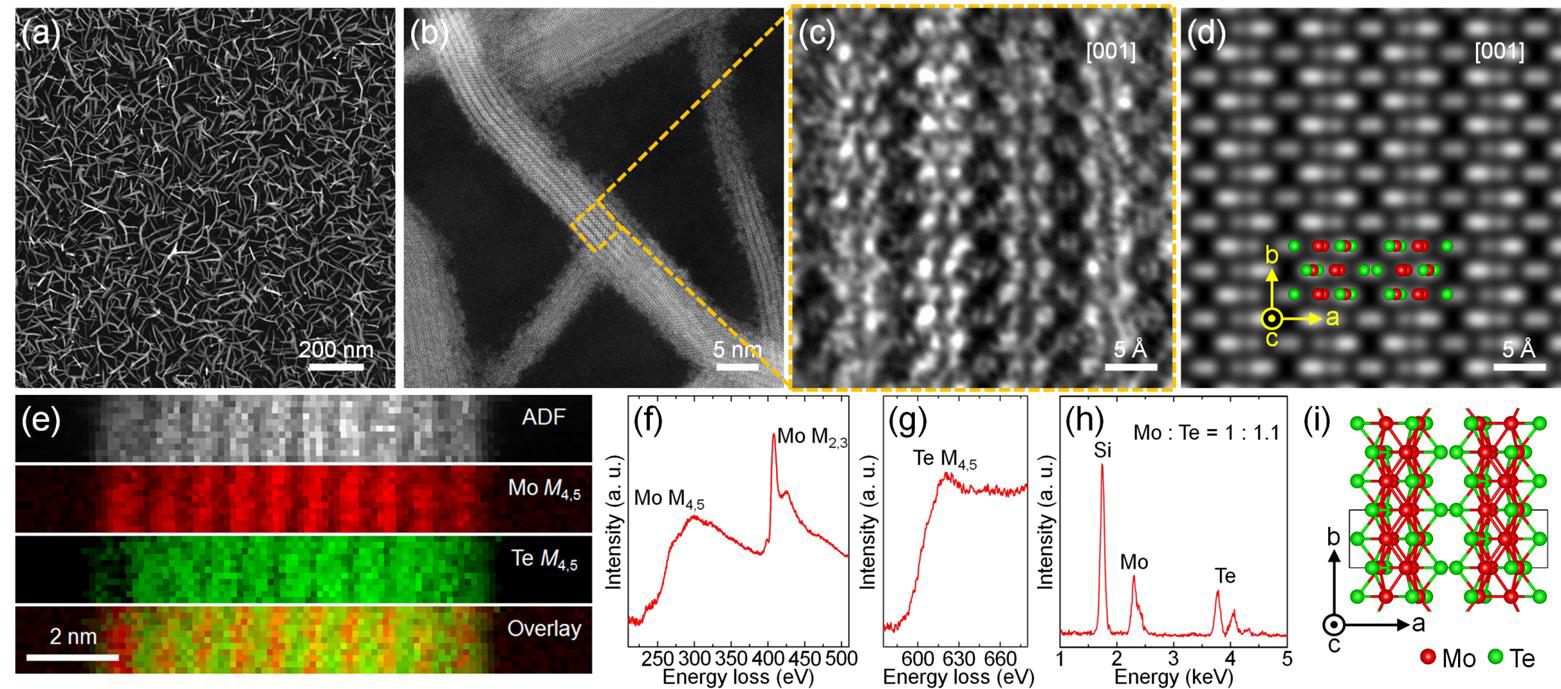
Figure 5. Growth of Mo6Te6 nanowires. A) SEM and B) TEM of nanowires, C) Atomic Resolution TEM Image of nanowire D) Simulated TEM image of the proposed Mo6Te6 structure. E) EELS image showing the presence of Mo and Te. F) and G) EELS spectrum showing only Mo and Te. H) EDS spectrum showing a composition of MoTe I) Proposed structure for Mo6Te6