Reports: ND654607-ND6: Non-Equilibrium, Atmospheric-Pressure Microplasmas for Hydrocarbon Gas Conversion
 printer friendly
1. Introduction
The goal of this ACS PRF ND project is to develop an atmospheric-pressure gas discharge (plasma) for non-equilibrium, non-oxidative conversion of methane (CH4) to hydrogen (H2), acetylene (C2H2), and other higher order hydrocarbon gases.
2. Experimental and modeling approach
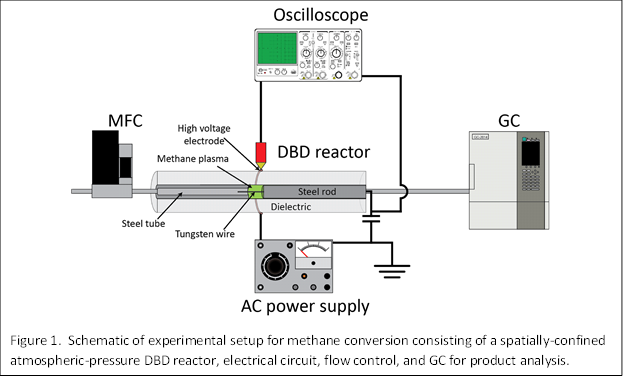
Our experimental setup shown in Fig. 1 consisted of a dielectric barrier discharge (DBD) reactor operated by a high-voltage alternating current (AC) power supply, an oscilloscope to monitor the current and voltage waveforms, a mass flow controller (MFC) to supply a constant gas flow, and a gas chromatograph (GC) to characterize the gas effluent. A unique aspect of our approach is that the plasma was spatially confined by a split inner electrode whose gap could be varied so that the volume the plasma occupies was systematically changed. The ability to control volume is critical to decoupling the effect of volume and power on reaction conversion.
A significant part of our effort this past year was to develop modeling in support of the experiments. Simulations were carried out using the exact same conditions as experiments and assuming a plug-flow reactor (PFR). The reaction network associated with direct conversion of methane by a plasma process was modeled by a microkinetic approach. Rate coefficients, k(T), for molecule-molecule reactions were obtained from the literature, and for electron-molecule reactions were calculated, with the electron energy distribution function and electron temperature obtained by solving the Boltzmann equation. Reactor modeling was performed with the CHEMKIN software package and solution of the Boltzmann equation was performed with the BOLSIG+ software package.
3. Results
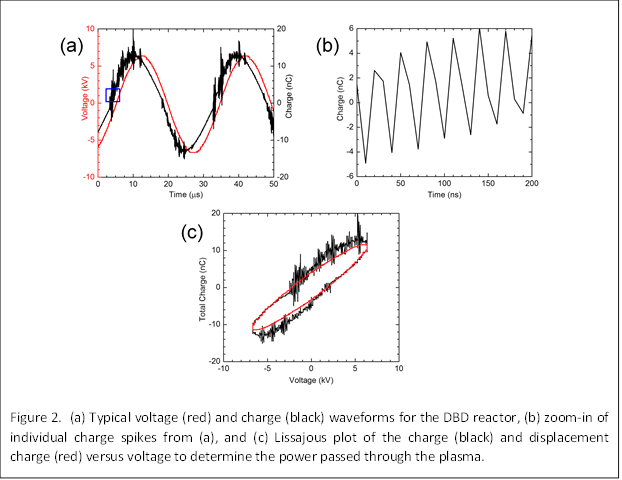
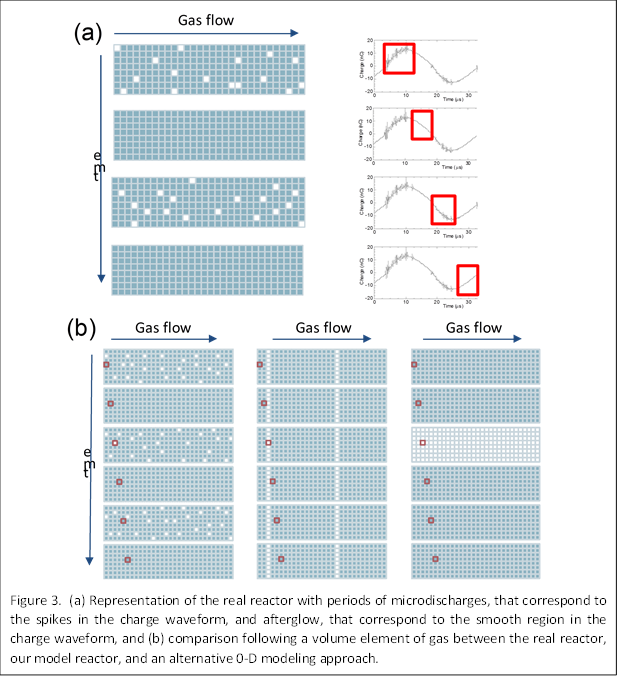
Even when the total volume of a DBD is controlled, the filling of the volume by the plasma is nonuniform, both in space and time. We characterized the nonuniform nature of the DBD by analyzing the voltage and charge waveforms; typical waveforms are shown in Fig. 2a. The spikes in the charge waveform correspond to microdischarges that form randomly in space and time during the rising and fall edge of the voltage waveform (Fig. 2b). After the microdischarge extinguishes, the volume is occupied by a plasma in an afterglow state, characterized by a decaying electron temperature and density. We estimated the duration of the afterglow state from the following equation:
τmicrodischarge +τafterglow = 1/(fplasma Afilament)
where τmicrodischarge is the time duration of a microdischarge, fplasma is the frequency of microdischarges per unit area, and Afilament is the area of a microdischarge. The voltage and charge waveforms were also used to construct Lissajous plots and estimate the power in the plasma (Fig. 2c).
Based on the nonuniform nature of the DBD reactor, we developed a reactor model extending from the classical PFR. As depicted in Fig. 3a, in the real reactor, the microdischarges randomly form in space and time, followed by the afterglow. In our model, we assumed that the microdischarges are all occurring at the same time, for a duration equivalent to τmicrodischarge followed by the afterglow. These two reactor segments were repeated until the total volume of reactor was reached. Our approach can be compared to the real reactor and a zero-dimensional (0-D) model where the whole reactor volume is either filled with microdischarges or afterglow (Fig. 3b).
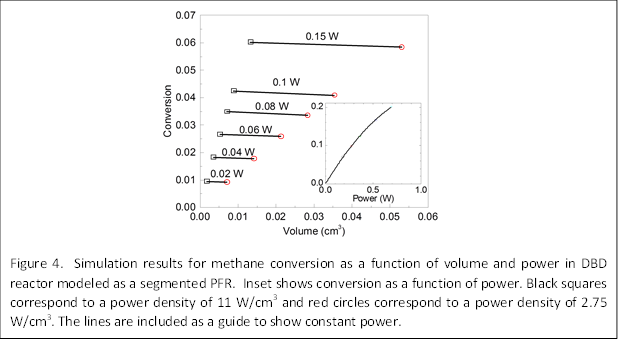
Simulation results based on our segmented reactor model are shown in Fig. 4 for methane conversion as a function of volume and power. Two different power densities of 11 and 2.75 W/cm3 were considered. As volume is increased, there is an apparent increase in the conversion of methane. However, we note that this is due to the increase in power that is necessary to keep the power density constant. At constant power, we see that different volumes give nearly the same conversion (see black and red data points). This indicates that the conversion depends on the power, not the volume. Simulations were also performed by varying the volumetric flow rate of methane into the reactor, and showed that as flow rate increased, conversion decreased.
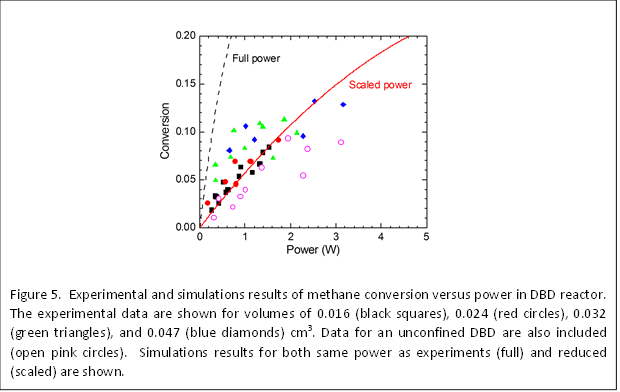
Experimental measurements of methane conversion in the DBD reactor at different volumes and powers are shown in Fig. 5. While some scatter is found in the data, we believe this is mostly due to experimental error in the power measurements, and overall, the experimental results show that the conversion depends on power and is independent of volume, consistent with the simulation results. The simulation results at full power showed the same trend but higher conversions. This may be because the power measured in experiments was higher than the actual power going into the reaction. By assuming a scaled power, the simulation results were found to give an excellent fit to the experimental results. The experimental results of conversion as a function of flow rate also agree with the simulation results, that the conversion decreases with increasing flow rate.
In conclusion, we have shown through a new segmented modeling approach and experiments that methane conversion in a DBD reactor depends only on power and not volume. We suggest that this is physically correct because conversion in a plasma is related to the energy density, E/V, were is E is energy and V is volume, which is equivalent to P/Q, where P is the power and Q is the volumetric flow rate. Thus, conversion depends on power and flow rate, but not volume. While these findings were demonstrated for methane specifically, we believe they are applicable to any gas conversion involving a DBD reactor.
4. Impact of project
This project has established a new direction of research for the PI, Prof. Sankaran, and Co-PI, Prof. Lacks in the area of gas conversion by plasma-based approaches. Prof. Sankaran has developed experimental techniques for controllably converting gases and characterizing the reactions. Prof. Lacks has developed modeling techniques for predicting the reaction conversion and selectivity. The project is also training a PhD student, Joe Toth. Joe will be presenting the results at the upcoming Gaseous Electronics Conference (GEC) meeting in Pittsburgh, PA, and a manuscript is being prepared for submission.