Reports: DNI954753-DNI9: Interaction Physics of Deflagrated Methane Flame with Fluidic Flow for Pressure Gain Combustion
 printer friendly
Detonation is a high energetic mode of pressure gain combustion that exploits total pressure rise to augment high flow momentum and thermodynamic efficiencies. Detonation is initiated through flame acceleration driven by turbulence interaction and induction for Deflagration-to-Detonation Transition (DDT). There is a broad desire to unravel the physical mechanisms of turbulence induced DDT. The study examines the role of turbulence induced by a fluidic jet on turbulent accelerating flames. The investigation aims to classify the turbulent flame dynamics and temporal evolution of the flame stages throughout the turbulent regimes.

Fig. 1. Schlieren imaging of turbulent (left) and laminar (right) flame interaction with fluidic jet
The motivation of the investigation under the ACS-PRF grant is to identify key characteristics and acceleration effects produced by the interaction of a deflagrated turbulent flame with a turbulent jet. High-speed Schlieren flow visualization is used to highlight the overall structures and flame-flow characteristics generated by the interaction. The time evolution of the Schlieren images is displayed in Figure 1.
The turbulence intensity and conditions of the mixture prior to ignition are characterized. Flow field samples of the turbulence ahead of the flame are acquired with PIV. Turbulence is generated in the reactant flow field by triggering the high pressure slot jet within the chamber before ignition. Turbulence homogeneity is achieved after a settling duration of 4 ms. At this stage, the deflagrated flame is ignited. The turbulence characteristics before ignition are described with instantaneous velocity, vorticity, and vector field plots shown in Figure 2. The horizontal velocity displayed in Figure 2a shows a random velocity field ranging within +/- 11SL with approximately zero mean velocity, derived from a sample sequence of instantaneous snapshots. The vertical velocity component is similar in magnitude and distribution; therefore it is not included. The turbulent vorticity field is presented in Figure 2b. Normalized by the laminar flame thickness lf = 433 μm and SL, the vorticity magnitudes range from +/- 3 lf /SL validating uniform turbulence distribution within the chamber.

Fig. 2. (a) Axial velocity, (b) vorticity, and (c) vector fields of turbulent reactants before ignition
The first stages of the turbulent flame propagation before the interaction are analyzed. Figure 3 shows the contour of the flame boundary profile as it expands over a small time interval Δt = 0.019 ms, from the black solid outline (time = 0 ms) to red dashed outline (time = 0.019 ms). The expansion of the flame profile is explored at the stage prior to direct interaction with the turbulent jet. The largest flame profile change occurs at the front and lower boundary of the flame, which is in the direction of the overall flame propagation, and where the bulk of the high-turbulence flow is present. As the flame advances, it interacts with the turbulent flow field, increasing flame wrinkling and driving further gas expansion. The top boundary of the flame is not directly exposed to the velocity fluctuations; therefore, it is not noticeably expanding. This characteristic highlights the influence of turbulence as well as the expansion towards the unconfined region, i.e., open end. The flame profile expansion is quantified using the flame stretch, k, shown in Equation 1 and plotted in Figure 3a. The area values represent the two-dimensional surface area of the flame front, shown by the flame contour in Figure 3b. A1 represents the area of the flame in the first frame, I, and dA is the change in flame surface area between the black and red outlines. The flame boundary becomes increasingly turbulent as it advances, demonstrated in both the flame boundary and the increasing trend of the flame stretch.
![]()
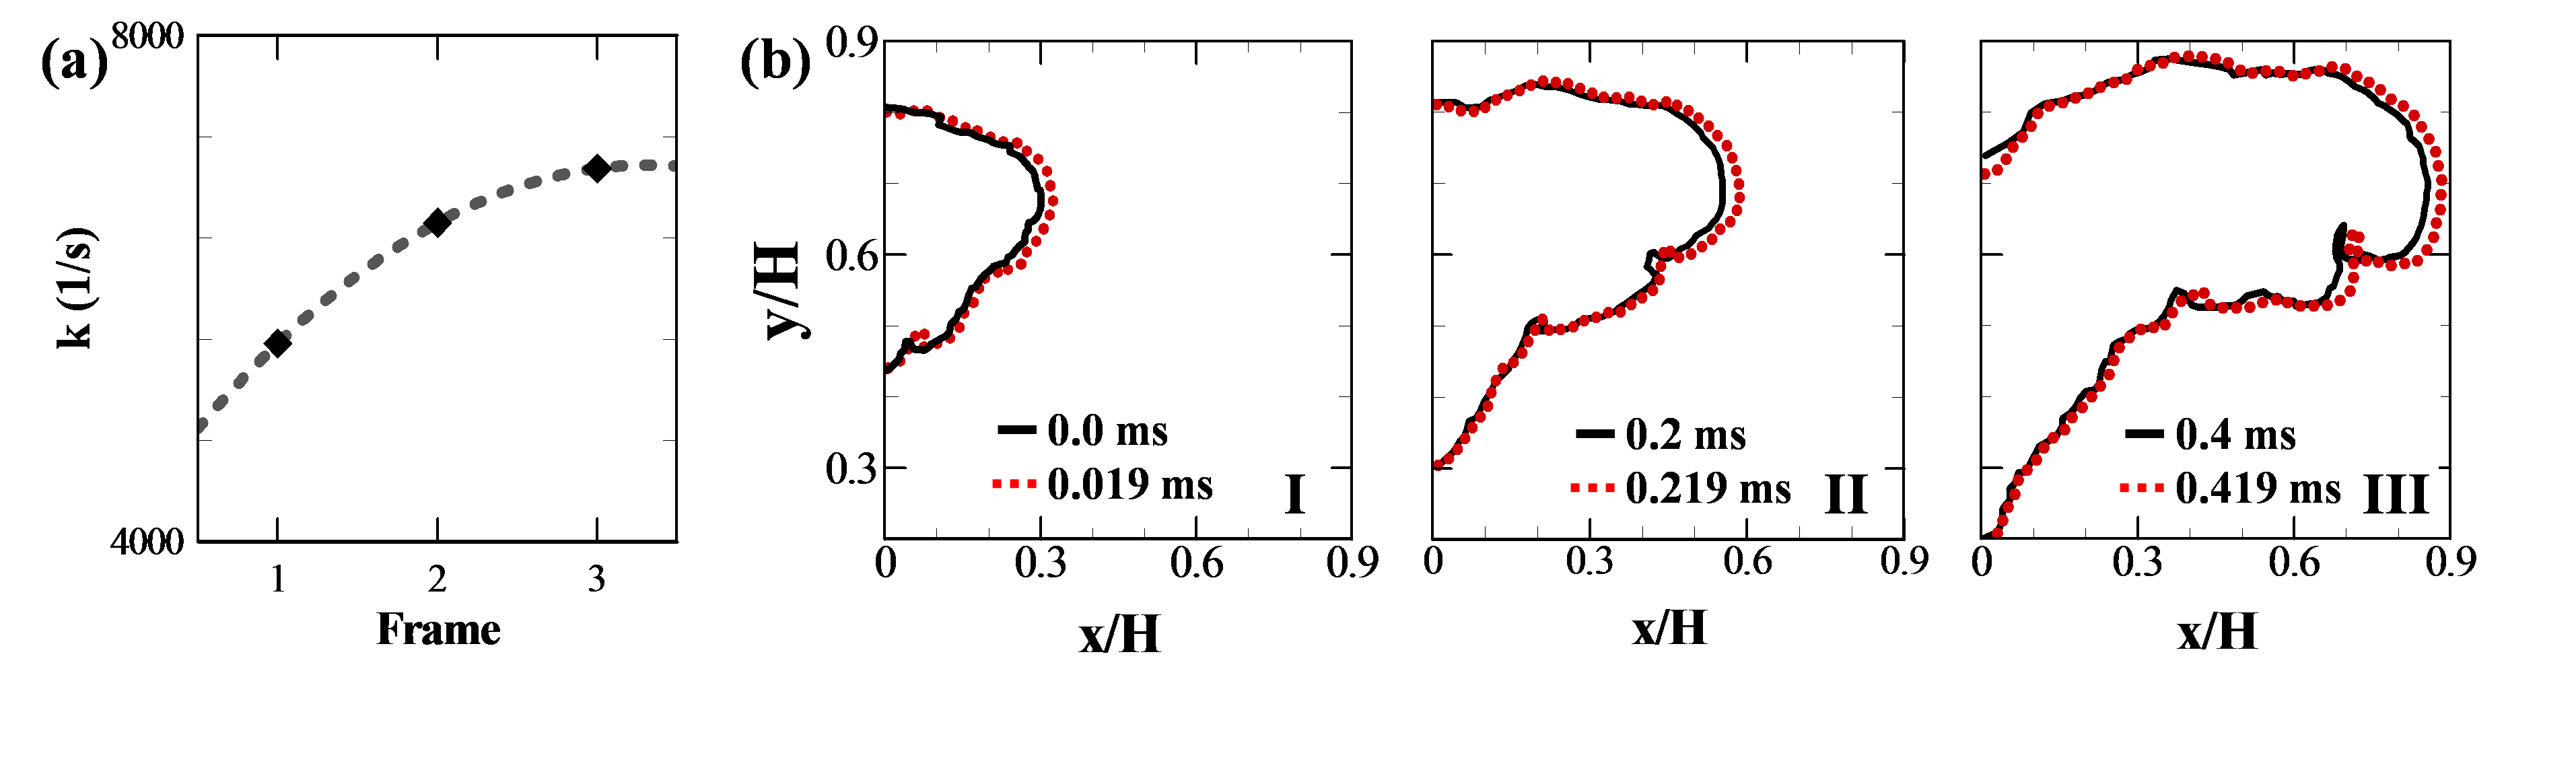
Fig. 3. (a) Flame stretch, and (b) flame boundary evolution for frame I, II, III
The turbulent flame speed, ST, is computed before the flame-turbulence interaction using two methods: direct experimental measurements, and turbulent flame speed correlation. This is calculated using Equation 2, originally derived by Damköhler from mass conservation,
![]()
where AT is the instantaneous surface area of the turbulent flame front while AL is the area of a normal laminar flame.
Figure 4 details the relationship between burning rates and turbulence. The range of flame speeds at different length scales (L11/lf = 1, 10, 100) are depicted in the plot. The defined boundaries proposed by Peters support the notion that larger length scales and turbulent Reynolds numbers result in higher turbulent flame speeds. The evolution of the burning velocities relative to the turbulent intensities are shown for the three flame stages (I, II, and III) from Figure 3. Higher burning velocities are observed as the flame interacts with the turbulent flow field. For comparison, the flame speed computed using the correlation by Peters based on the local turbulence conditions is also depicted. The correlation-based flame speed falls in between the flame at stage I and stage II.
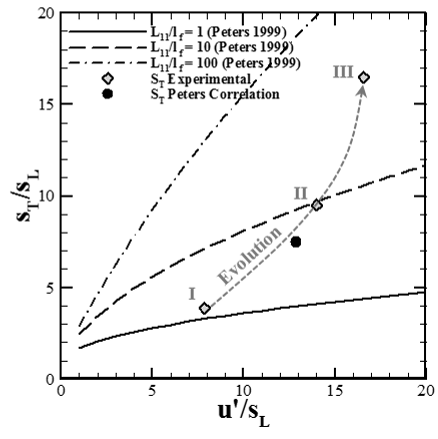
Fig. 3. (a) Flame stretch, and (b) flame boundary evolution for frame I, II, III
The PI tremendously appreciates the ACS PRF DNI grant. The research on this grant had and continues to have a profound influence on the PI’s research career portfolio. The PI have been awarded an AFOSR grant to heavily leverage the current ACS-PRF project and substantially extend its impact by exploring the compressibility effect in the turbulent flame regime spectrum from low compressible deflagrated flames to highly turbulent compressible detonation flames. Additionally, seven students and a post-doc benefited from this research and received their degrees (M.S. and B.S. Honors in Major Thesis) under this research with the continuation to PhD on this research. Numerous publications [1-4] have been achieved from the research including an American Physics Society – Division of Fluid Dynamics, 2015 Gallery of Fluid Motion. This ACS DNI grant augmented the PI’s career and can be considered an overwhelming success.