Reports: ND656174-ND6: Electronic Laser Photodissociation Spectroscopy of Gas-Phase Metalloporphyrins and Metalloporphyrin-Aromatic Molecule Complexes: Investigating the Evolution of the Soret Band of Petroporphyrins
 printer friendly
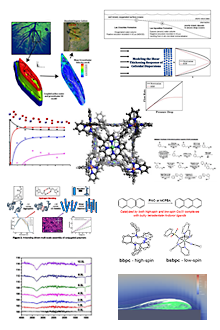
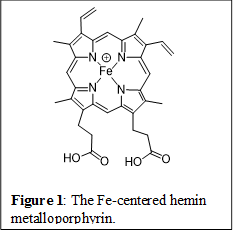 The project aims to study the electronic spectroscopy and photochemistry of isolated, gaseous metalloporphyrins (Figure 1) and their aromatic molecule complexes. These studies are being performed for the first time in a novel custom-adapted laser-interfaced commercial mass spectrometer, where the porphyrins are produced as gaseous ions via electrospray ionization, mass-selected and then subjected to laser photoexcitation within an ion trap. Excellent progress has been made on the project over the year, including the production of several metalloporphyrins and their aromatic complexes via electrospray, and the measurement of their gas-phase electronic spectra.
We began work on the non-metallated prototype porphyrin system, TPP. This is a synthetic porphyrin, although metallated forms of it are found as petroporphyrins (i.e. geochemical metalloporphyrins). In its neutral state, it is highly symmetric and has a characteristic absorption profile with an intense Soret band (lmax=415 nm) and four Q bands (lmax = 514, 549, 589, 646 nm). On protonation, this high symmetry is lost, with the Soret band known to red-shift in solution, while the four Q bands collapsing to two bands. We were successful in electrospraying TPP in its protonated form, TPP∙H+, and measuring the first gas-phase absorption (or photodepletion) spectrum (Figure 2).
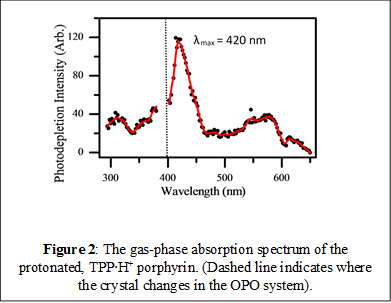
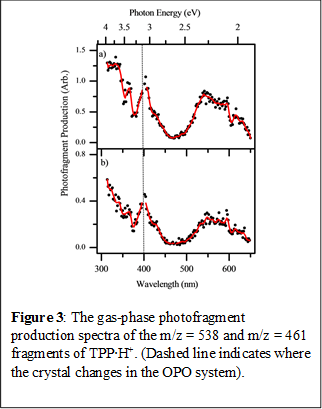
The prominent Soret band can be seen clearly in the gas-phase spectrum, with lmax = 420 nm. This feature is notably blue-shifted by 19 nm compared to the solution-phase spectrum. Our experiments have also allowed us to investigate the photodegradation products across the same spectral region. We have identified two photodegradation channels, associated with loss of either one (photofragment m/z = 538) or two (photofragment m/z = 461) benzene rings respectively. The relevant photofragment action spectra are shown in Figure 3, and reveal that although both photofragments are produced with the same spectral profile (indicating the same decay pathway) intriguingly, the fragments are produced relatively more strongly through the Q-branch region of the spectrum (the lower energy spectral range). It is also notable that the pair of photofragments observed differ from thermal fragments observed from this porphyrin upon low-energy CID, where only the m/z=538 fragment is produced. Our initial conclusion is that the gas-phase excited states accessed through both the Q and Soret band are relatively long-lived, thus allowing evolution on the excited state surface and production of distinctive (i.e. non-ground state) photofragments. This work is currently being written up as a Chemical Physics Letter. Our results provide an excellent set of benchmark data for dynamical excited state calculations.
Following on from our work on the non-metallated TPP∙H+, we have measured the gas-phase electronic absorption spectra of several metalloporphyrins, namely hemin+, which contains an Fe center, FeTPP+, a vanadium oxide TPP system (VOTPP), and finally NiTPP. The initial optimization of the electrospray conditions to produce sufficient quantities of the metalloporphyrins in the gas-phase was challenging, but we have now developed an excellent methodology for producing strong gaseous metalloporphyrin ion signals. Figure 4 provides an example of one of the metalloporphyrin spectra (FeTPP+) we have recorded. Although the strong Soret band is clearly visible in this spectrum (lmax=415 nm), the Q-band which occurs in the solution-phase spectrum, appears absent in the gas-phase spectrum. We conducted a series of power-dependent measurements to investigate whether the spectral profile changes with laser power and found that the Q band did in fact reappear when higher laser powers are employed. This measurement again reveals information about the dynamical nature of the metalloporphyrin excited states as it indicates that Q band excitation accesses a very long-lived excited state, requiring extra energy (in the form of the second photon) to effect decay.
Photofragmentation studies were conducted alongside the photodepletion (absorption) measurements. Intriguingly, the photofragmentation of the metalloporphyrin, FeTPP+, produced identical fragments as the protoporphyrin, TPP∙H+, indicating that the metal centre is not controlling the excited state characteristics to any significant extent.
![Figure 4: The gas-phase photodepletion spectrum (absorption) of [FeTPP]+. The red solid line represents a three point adjacent average of the data: the blue line presents an expanded view of the Q-branch region. The dashed line represents the OPO crystal switch wavelength.](abimages/Paper_14942_abstract_36746_0.png)
Work is now proceeding to conduct computational calculations on the metalloporphyrins to allow us to compare the experimental spectra with calculated spectra. These calculations are relatively time consuming given the molecular size. Once these calculations are completed, we anticipate that this part of the study will be published in JPC A. Some further experimental work is also needed to check the spectral integrity (in terms of ion intensity) across the crystal change in the OPO (dashed line on figures). The spectra shown above have been recorded across a very large spectral range for gas-phase spectra and it will be important to check that the ion-intensity is internally consistent across the entire range.
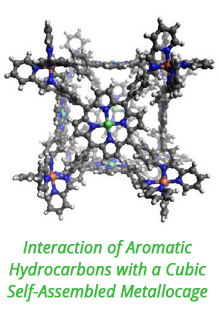
![Figure 5: A metalloporphyrin-nitrogen containing aromatic complex, [FeTPP]+∙pyridine, illustrating axial coordination of the aromatic.](abimages/Paper_14942_abstract_36747_0.png)
Finally, we have moved on to perform the first measurements of metalloporphyrins bound to nitrogen containing aromatics (e.g. Figure 5). We were successful in producing the required species via electrospray, and obtaining photodepletion and photofragmentation spectra. Some very interesting results have been obtained, and we will now to perform calculations and full analysis of the data obtained. As an example, Figure 6 displays the photodepletion spectrum of a [FeTPP]+∙pyridine complex (Figure 5). The strong Soret band is still visible at lmax=370 nm and a much weaker Q-band at 490 nm.
![Figure 6: The gas-phase absorption spectrum of [FeTPP]+∙pyridine. The red solid line represents a three point adjacent average of the data. The dashed line represents the OPO crystal switch over wavelength.](abimages/Paper_14942_abstract_36748_0.png)