Reports: DNI856969-DNI8: Characterizing Basin Structure with Dense Passive Seismic Arrays
 printer friendly
Understanding the evolution and structure of sedimentary basins is fundamental to the knowledge of petroleum systems. High-resolution seismic imaging of sedimentary basins constrains basin development and architecture, but traditionally involves manmade sources and dense instrument arrays at high logistical and monetary costs. The PI and her research team have been utilizing emerging methodologies and data analysis techniques to explore basin and upper crustal structures in central New Mexico by densely-spaced, continuously recording seismometers. With more than 800 seismometers in each deployment, these ‘large-N’ arrays offer unique opportunities for high-resolution passive source imaging.
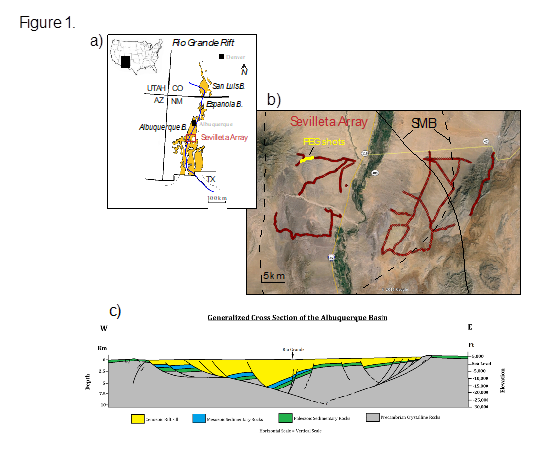
Figure 1. a) Sevilleta Array. b) ~800 node Sevilleta Array, February 2015 (red diamonds). Black solid and dashed lines outline of uplift due to SMB inflation. c) Composite geometry of Albuquerque basin.
The work completed under this award during the first year focuses on the Sevilleta seismic array. The Sevilleta Array comprised 800 vertical-component Nodal seismic stations with 10-Hz seismometers deployed in the central Rio Grande rift north of Socorro, NM, for a period of 12 days during February 2015 (Figure 1). The project objective was to determine basin and upper crustal structure in the middle Rio Grande rift, above the Socorro Magma Body (SMB). The SMB is one of the largest recognized active mid-crustal magma intrusions globally. Inflation of the SMB drives uplift at rates of up to of few millimeters per year.
Current work and results focus on two seismological techniques: ambient noise tomography and teleseismic virtual reflection imaging. Future work will apply ambient noise tomography to a similar dataset in the Bighorn and Powder River Basins in northern Wyoming. The grant supported research by one postdoctoral researcher and one graduate student at University of New Mexico. Since being awarded the PRF, the PI has used preliminary results as seed data and proof of concept in two successful National Science Foundation proposals focused on crustal imaging.
CURRENT RESULTS
Task 1. Shallow velocity structure from ambient noise tomography
We examined the upper crustal structure of the northern section of the SMB region using ambient noise data collected from the Sevilleta Array constrain basin structure and identify possible upper crustal heterogeneities caused by heat flow and/or fluid or magma migration to shallower depths. Additional data from 5 short period seismic stations from the New Mexico Tech network south of the Sevilleta array enhance the ray coverage.
Inter-station ambient noise cross-correlations from all available 20-minute time windows were stacked to obtain estimates of the vertical component Green’s function. Clear fundamental mode Rayleigh wave energy is observed from 1 to 10 s period.
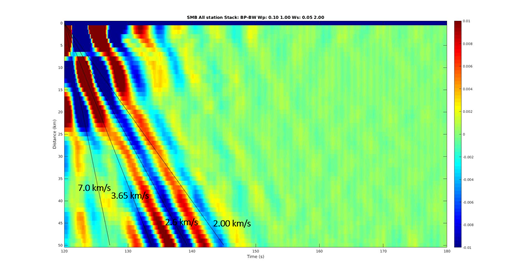
Figure 2. Ambient noise cross-correlation across Socorro Magma Body for 12 days of data bandpass filtered with 1 to 10 s period. Reference velocities include 7.0 km/s, 3.65 km/s, 2.6 km/s and 2.00 km/s.
The dominant noise sources originate from the southwest, near Baja, CA.
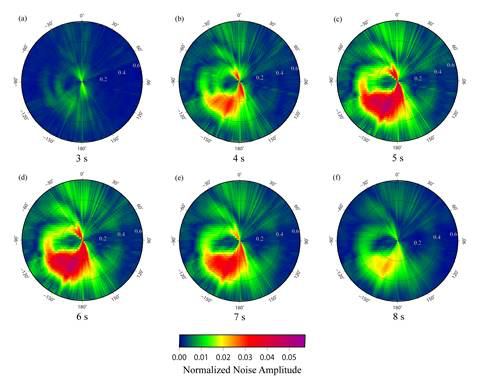
Figure 3. Back azimuthal angle vs. phase slowness plots of beamforming of all the cross correlations for (a) 3 s (b) 4 s (c) 5 s (d) 6 s (e) 7s (f) 8 s periods. Normalized noise amplitude is highest at 5 and 6 s periods.
The automated frequency-time analysis (FTAN) method was implemented to measure fundamental mode Rayleigh wave phase velocities. Positive and negative lags of the cross-correlation were average to obtain a more symmetric cross-correlation and improve signal-to-noise ratio (SNR). After 2-π ambiguity corrections for all the periods, the travel times were inverted to obtain 2-D phase velocity maps at 3 to 8 s periods (Figure 4).
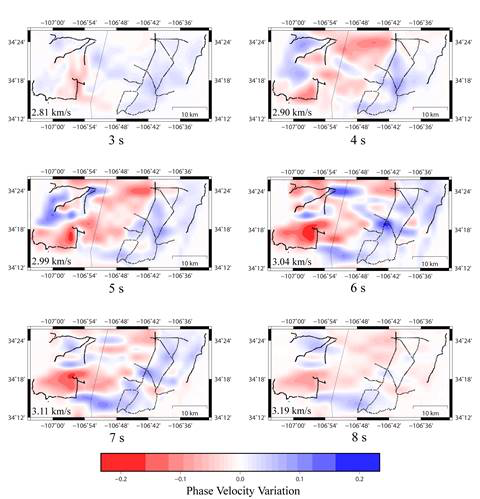
Figure 4. Rayleigh phase velocity maps produced at (a) 3 s (b) 4 s (c) 5 s (d) 6 s (e) 7s (f) 8 s periods. Largest variation in phase velocity is observed at 5 and 6 s periods.
The Rayleigh wave phase velocity maps are sensitive to a depth interval of ~1 to 8 km, depending on wave period. The largest velocity variations (~7%) are found from ~5-6 s periods. Alluvial sediments in the Socorro Basin consistently show lower velocities than the basin-bounding ranges. One low velocity zone is co-located with the area of maximum InSAR-observed uplift related to the SMB. A second low velocity zone surrounds the Paleogene-aged Black Butte Volcano. In future work, we plan to invert Rayleigh wave phase velocity maps to create 3-D S wave velocity map of SMB using a non-linear Bayesian Monte-Carlo method.
Task 2. Teleseismic virtual reflection profiling
Teleseismic virtual source reflection profiling (TVR) employs the free surface reflection off of a teleseismic P as a virtual source in dense arrays, and has been used successfully to image basin structure and the Moho in multiple tectonic environments. The Sevilleta Array recorded 62 teleseismic events greater than M5. Four events with high SNR and simple source-time functions are used in the analysis: the 02/11/2015 M6.7 in northern Argentina, the 02/19/2015 M5.4 in Kamchatka, Russia, and the 01/21/2015 M5.1 and 02/22/2015 M5.5 in western Colombia. Applying TVR involves the following steps: filtering an event to reduce the signal to noise ratio (Fig. 5A), using cross-correlation to align the first arrivals (Fig. 5B, C, D), deconvolving the estimated source wavelet (Fig. 5E) to determine the geologic response (Fig. 5F). Each event is processed and stacked them to enhance common features. Thus far, all of the aforementioned events have been aligned with cross correlation and have had a source wavelet estimated. The M5.5 in Colombia has been completely processed using TVR and current work is focused on deconvolving the other events in order to make a final stacked full array profile. Individual two-dimensional transects illuminate features beneath the array, such as a low-angle rift-bounding normal fault in the northwestern sector of the array (Fig.).
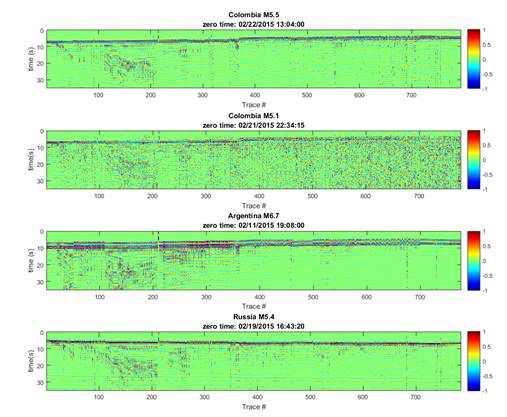
Figure 5. Four events used for TVR analysis as recorded by the Sevilleta Array, sorted by distance from NW to SE, filtered from 0.1-1 Hz.

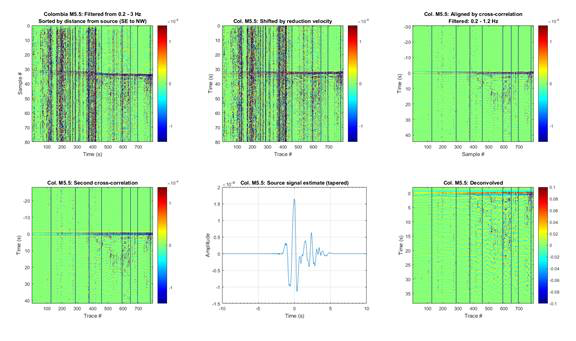
Figure 6. General workflow for TVR analysis (Colombia M5.5 event)
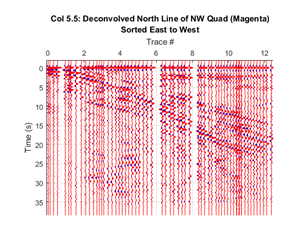
Figure 7. Top: Northwestern sector of array. Bottom: 2-D transect (pink line) imaging low-angle normal fault.