Reports: UR755397-UR7: Employing Light Scattering Analysis and Zeta Potential Measurements to Study the Assembly and Stability of Poly(3-Hexylthiophene) in Binary Solvent Mixtures
 printer friendly
One method to improve the conductivity of conjugated polymers (CPs) like P3HT is to “chemically dope” them with molecular electron donors or acceptors. One such acceptor that has been used extensively in tandem with P3HT is 2,3,5,6-Tetrafluoro-7,7,8,8-tetracyanoquinodimethane (F4TCNQ). Recently, there has been much interest in the nature of the interactions between F4TCNQ and P3HT in the solution-phase and the dependence of these interactions one the chemical characteristics of the solvent. To our knowledge, there are no reports that investigate the behavior of F4TCNQ-doped P3HT in binary solvent mixtures. The study reported herein, is a preliminary investigation of F4TCNQ-doped P3HT in solvent mixtures of chloroform (CF) with dichloromethane (DCM) or acetonitrile (AcN). The CF:DCM and CF:AcN blends were chosen primarily because of the different characteristics of P3HT aggregates in these mixtures and the disparate polarity and dielectric constants, e, of the pure solvents.
We investigated the solution phase behavior of F4TCNQ-doped P3HT+ in the CF:DCM and CF:AcN mixtures using UV/Vis absorption and Raman spectroscopy, and dynamic light scattering. We also used nanoelectrochemical measurements to assess the electrophoretic mobility, zeta-potential and conductivity of P3HT+/F4TCNQ– in the solvent mixtures. We contrast these solutions to P3HT+ in pure chloroform and neutral P3HT in the same solvent mixtures.

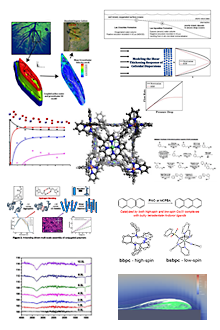
Figure 1. Representative (a) UV/Vis absorbance spectra, (b) particle size distributions (PSDs) and (c) Raman spectra of undoped P3HT in CF:DCM. Absorbance spectra, PSDs and Raman spectra in CF:AcN are shown (d), (e) and (f), respectively. The dotted and dashed lines in (c) denote the signal of amorphous (~1470 cm–1) and aggregated (~1442 cm–1) P3HT, respectively.
Table 1. Ratio of A0-0 and A0-1 vibronic features (Rabs), extent of aggregation (k), hydrodynamic diameter (Dh), electrophoretic mobility (m), conductivity (s), and zeta potential (z) of aggregate dispersions of neutral (pristine).
Solvent
|
| Rabs
|
| k/%
|
| Dh/nm
|
| m/mm·cm·V–1·s–1
|
| s/mS·cm–1
|
| z/mV
|
80:20 CF:DCM
|
| 1.019
|
| 5
|
| 250
|
| 0.9123
|
| 2.14×10⁻⁴
|
| 76.4
|
60:40 CF:DCM
|
| 1.010
|
| 10
|
| 280
|
| 0.7563
|
| 2.31×10⁻⁴
|
| 70.2
|
40:60 CF:DCM
|
| 0.999
|
| 24
|
| 305
|
| 0.6083
|
| 4.55×10⁻⁴
|
| 62.3
|
20:80 CF:DCM
|
| 0.917
|
| 40
|
| 375
|
| 0.4224
|
| 3.60×10⁻⁴
|
| 51.5
|
80:20 CF:AcN
|
| 0.792
|
| 62
|
| 93
|
| 2.553
|
| 1.12×10⁻³
|
| 46.6
|
60:40 CF:AcN
|
| 0.786
|
| 68
|
| 99
|
| 2.325
|
| 1.02×10⁻³
|
| 46.5
|
40:60 CF:AcN
|
| 0.773
|
| 70
|
| 120
|
| 1.303
|
| 2.74×10⁻³
|
| 30.3
|
20:80 CF:AcN
|
| 0.759
|
| 70
|
| 127
|
| 0.873
|
| 7.16×10⁻⁴
|
| 17.0
|
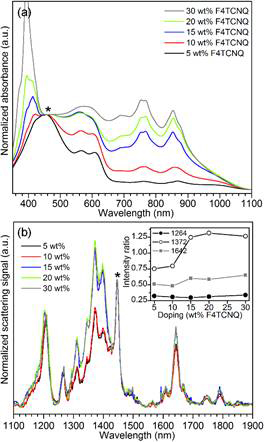
Figure 2. (a) UV/Vis absorption spectra of P3HT in pure chloroform with F4TCNQ dopant concentrations of 5-30 wt%. The spectra are normalized to the absorbance maximum of the amorphous P3HT band at 450 nm (*). (b) Raman spectra of P3HT in pure chloroform with F4TCNQ dopant concentrations of 5-30 wt% normalized to C=C (polythiophene) band a 1450cm–1 (*). The arrow denotes a new feature at ~1400 cm–1, which is not observed in undoped P3HT. The inset shows the ratio of the intensity of the key P3HT+ (1372 cm–1) and F4TCNQ·– (1264 cm–1 and 1642 –1) features to the C=C band a 1450cm–1 (*).
Table 2. Electrophoretic mobility (m), conductivity (s), zeta potential (z), and hydrodynamic diameter (Dh) of (5-30 wt%) F4TCNQ-doped P3HT in pure chloroform.
wt% F4TCNQ
|
| m/mm·cm·V–1·s–1
|
| s/mS·cm–1
|
| z/mV
|
| Dh/nm
|
5
|
| 0.673
|
| 2.83×10⁻⁴
|
| 135
|
| 251
|
10
|
| 0.641
|
| 2.77×10⁻⁴
|
| 129
|
| 293
|
15
|
| 0.613
|
| 2.61×10⁻⁴
|
| 123
|
| 275
|
20
|
| 0.566
|
| 2.40×10⁻⁴
|
| 114
|
| 265
|
30
|
| 0.402
|
| 1.88×10⁻⁴
|
| 81
|
| 250
|
We evaluated the doping process in CF:DCM and CF:AcN two ways. First, we fabricated the aggregates in the solvent mixtures in the presence of F4TCNQ. Next, we doped neutral P3HT aggregates that were fabricated in the solvent mixtures without the presence of F4TCNQ.
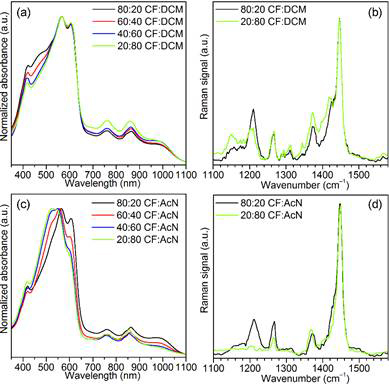
Figure 3. Representative (a) UV/Vis absorption and (b) Raman spectra of P3HT:F4TCNQ solutions in CF:DCM solvent mixtures using a 5 wt% concentration of F4TCNQ. The absorption and Raman spectra p-doped P3HT (5wt% F4TCNQ) in CF:AcN are shown in (c) and (d), respectively.
Table 3. Electrophoretic mobility (m), conductivity (s), zeta potential (z), and hydrodynamic diameter (Dh) of P3HT aged for 24 hours in the presence of 5 wt% F4TCNQ.
Solvent
|
| k
|
| m/mm·cm·V–1·s–1
|
| s/mS·cm–1
|
| z/mV
|
80:20 CF:DCM
|
| 1.7
|
| 0.464
|
| 3.52×10⁻⁴
|
| 57.0
|
60:40 CF:DCM
|
| 1.7
|
| 0.370
|
| 3.24×10⁻⁴
|
| 37.0
|
40:60 CF:DCM
|
| 1.9
|
| 0.316
|
| 2.98×10⁻⁴
|
| 28.5
|
20:80 CF:DCM
|
| 2.3
|
| 0.281
|
| 2.63×10⁻⁴
|
| 24.0
|
80:20 CF:AcN
|
| 1.8
|
| 0.688
|
| 1.63×10⁻³
|
| 25.0
|
60:40 CF:AcN
|
| 1.5
|
| 1.160
|
| 3.73×10⁻³
|
| 27.0
|
40:60 CF:AcN
|
| 1.3
|
| 1.694
|
| 4.75×10⁻³
|
| 34.0
|
20:80 CF:AcN
|
| 1.2
|
| 2.729
|
| 5.17×10⁻³
|
| 50.0
|
.
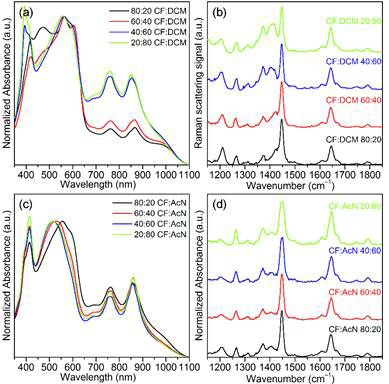
Figure 4. Representative UV/Vis absorption and Raman spectra of P3HT aggregate dispersions in CF:DCM, (a) and (b), and CF:AcN, (c) and (d), mixtures doped with 5 wt% F4TCNQ.
Table 4. Electrophoretic mobility (m), conductivity (s), zeta potential (z), and hydrodynamic diameter (Dh) of 5 wt% F4TCNQ-doped P3HT aggregates.
Solvent
|
| k
|
| m/mm·cm·V–1·s–1
|
| s/mS·cm–1
|
| z/mV
|
80:20 CF:DCM
|
| 1.4
|
| 0.250
|
| 1.22×10⁻⁴
|
| 30.4
|
60:40 CF:DCM
|
| 1.8
|
| 0.460
|
| 3.58×10⁻⁴
|
| 47.1
|
40:60 CF:DCM
|
| 2.4
|
| 0.731
|
| 5.52×10⁻⁴
|
| 67.8
|
20:80 CF:DCM
|
| 2.2
|
| 0.988
|
| 1.14×10⁻³
|
| 82.7
|
80:20 CF:AcN
|
| 2.4
|
| 0.982
|
| 1.34×10⁻³
|
| 32.1
|
60:40 CF:AcN
|
| 1.9
|
| 1.532
|
| 3.44×10⁻³
|
| 35.6
|
40:60 CF:AcN
|
| 1.9
|
| 1.851
|
| 3.87×10⁻³
|
| 37.0
|
20:80 CF:AcN
|
| 1.8
|
| 2.059
|
| 5.57×10⁻³
|
| 37.6
|
Referring to Table 3 and 4, the CF:AcN systems exhibit the same general behavior, i.e., k, m, s and z have change monotonically with changing composition of chloroform. In contrast, the CF:DCM systems exhibit inverse behavior. For P3HT aged in the presence of F4TCNQ, m, s and z monotonically decrease with decreasing composition of chloroform (Table 3), whereas m, s and z monotonically increase with decreasing composition of chloroform when the aggregates are aged prior to doping with F4TCNQ (Table 4). We are working to determine if the variations in these trends can be used to develop a description of these systems within the framework of DLVO theory.
To date, seven students have been fully or partially funded by this grant. Currently, one student is a SULI intern at the National Renewable Energy Laboratory in Golden, two are graduate students at the University of Virginia, and the other four are still attending the College of Charleston. One of the students that began working in the lab in summer 2016 was awarded a Goldwater Scholarship in Spring 2017. In November 2016 two students presented their work at the Southeast Regional Meeting of the American Chemical Society (SERMACS) in Columbia, SC. To date, we have published five papers with partial support of the donors of the American Chemical Society Petroleum Research Fund