Reports: DNI756499-DNI7: Fundamental Understanding of Anisotropic Ion Transport in Charged Block Copolymer Microdomains: Large-Scale Mesoscopic Simulations of Phase Diagrams, Ion Diffusion Pathways, and Electric-Field Effects
 printer friendly
Introduction and Progress Summary for Year 1
Ionic conductivity in block copolyelectrolytes highly depend on the morphology of self-assembled microdomains at the molecular level. However, the influence of electrostatic interactions on morphology and ionic conductivity remains an obscure feature of this type of charged block copolymer (BCPs).1-3 Current theoretical understandings of phase diagrams of BCPs, whether obtained from mesoscopic dissipative particle dynamics (DPD) simulations4-5 or self-consistent field theory (SCFT)6-7, haven’t addressed the inherent difficulties of capturing the following elements simultaneously: (i) discretized local charge distributions and electrostatic interactions, (ii) quantifying the ionic transport process, and (iii) direct correlation between the ionic conductivity and the morphology anisotropy.8-10 Therefore, there are urgent needs to develop reliable computational tools to allow de novo design of charged BCP systems.
In Year 1 of this project, we have predicted the morphology of self-assembled block copolyelectrolytes using a modified DPD simulation framework, considering both electrostatic interactions and explicit ion diffusion. We identified microphase transitions based on the directly computed structure factor patterns. Finally, we mapped out a few phase diagrams under various experimentally-controllable parameters, including block A ratio (fA), Flory-Huggins parameter for A-B repulsive energy (χABN), block-A charge fraction (ϕ), and dielectric constant (εr).
Computed Phase Diagram of Neutral Diblock Copolymers
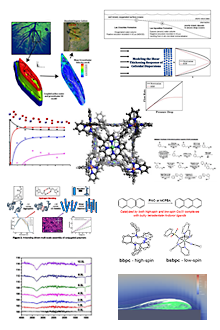
To validate our DPD simulation framework, we first predicted the morphology of neutral BCP systems. Ordered microphase structures, including lamellar L, gyroid G, cylindrical, C, spherical, S, and the corresponding inversed phases (B-rich), are observed as shown in Fig. 1. These phases were identifying by viewing the equilibrated simulation snapshots, which is further confirmed using computed structure factors (see Fig. 2) that mimic experimental X-ray diffraction spectra. We conclude that our DPD framework and the identification of phase diagrams conform well to both experimental and theoretical SCFT results.
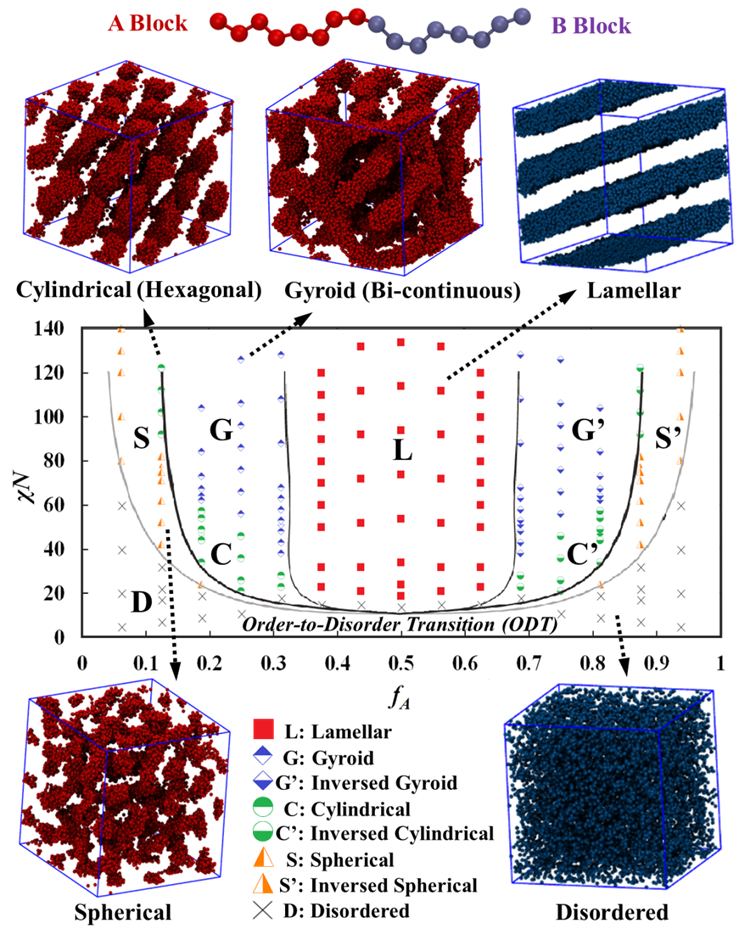
Figure 1: DPD-predicted phase diagram (as functions of fA and χABN) of a neutral A-B BCP system with representative simulation snapshots. Solid black lines show predictions using the SCFT by Schick et al.11 DPD simulation results are corrected here to account for the low-molecular-weight effect as proposed by Matsen.12 Only one of the two blocks (A in red and B in blue) is shown in the snapshots for clarity.
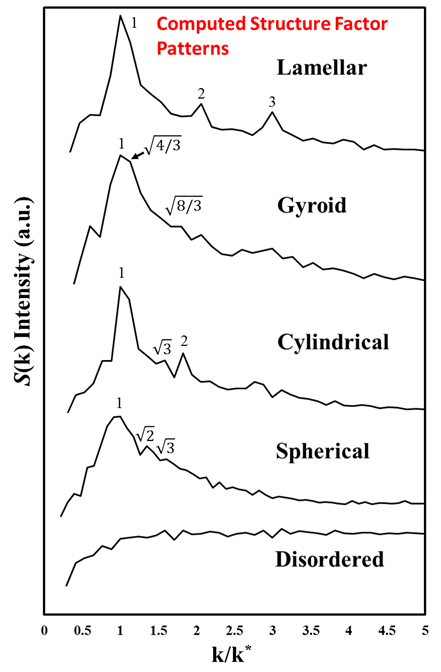
Figure 2: Structure factor patterns for neutral BCP microphases computed using DPD simulated trajectories. The characteristic peak locations for each microphase are marked by numbers. The x-axis represents the normalized k value by the location of the first primary peak, k*.
Computed Phase Diagram of Diblock Copolyelectrolytes
After validation the DPD framework for neutral BCP systems, we considered electrostatic interactions when positive counterions are introduced into the system and block-A beads are uniformly and negatively charged. Such block copolyelectrolyte system can be characterized by the dielectric constant (to reflect the impact from solvents), the ionic valence (for ions like Li+, Mg2+ and Al3+), and the charge fraction of the block A (ϕ, defined by the ratio between the number of counterions and that of block-A beads). We found that the ionic valence is directly proportional to the charge fraction of block A due to electroneutrality, and therefore, we only varied the charge fraction of block A in this project. The DPD-predicted phase diagrams for the charged BCP system are shown in Fig. 3 when ϕ = 1:4 and εr = 1.1 for a water-type solvent environment in the DPD framework.
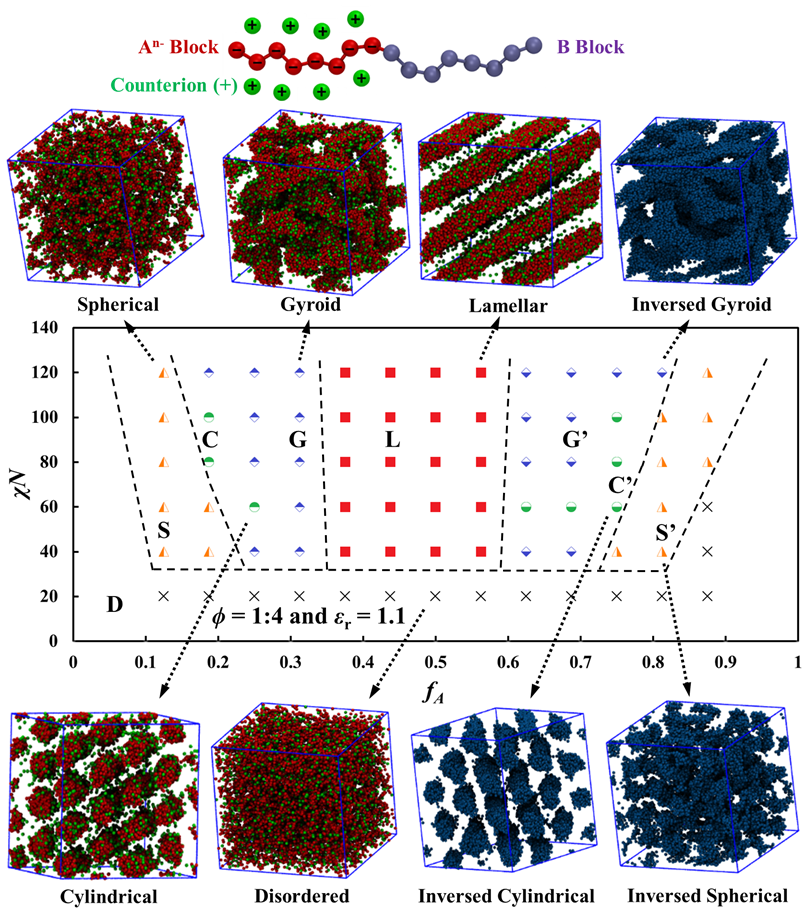
Figure 3: DPD-predicted phase diagram of the charged BCP system (An–B) with representative simulation snapshots. The dashed lines are guides to the eye. Only one of the two blocks (A in red and B in blue) is shown for clarity, while the counterions are always shown in green.
In addition, have also looked into charged BCP systems with when ϕ = 1:2 and 1:8 (both under εr = 1.1), as well as when ϕ = 1:4 but with a reduced εr = 0.275. The DPD-predicted phase diagrams are shown in Fig. 4. In general, these phase diagrams share two common features. First, at high χABN values when fA is increased, the phase transition follows the same order (D→S→C→G→L→G’→C’→S’→D) as that for neutral BCPs. Second, they all exhibit leftward (regarding boundaries between ordered phases or order-to-order transition, OOT) and upward (regarding order-to-disorder transition, ODT) shifts, compared to the neutral BCP phase diagram. When increasing or decreasing the charge fraction value ϕ to 1:2 or 1:8, respectively, such shifts of the boundaries between the ordered phases become more or less significant.
Excluded volumes contributed by the counterions which bind closely to block A electrostatically, increase the effective fA values in the phase diagram, which is a major reason behind the leftward shifts. In addition, the newly introduced Coulombic cohesion between block A and counterions, Coulombic repulsion between block-A beads, and Coulombic repulsion between counterions, are also responsible for the shifts. Specifically, charges would have two additional effects: (i) the binding between counterions and charged block A will increase the entropy, which would hinder phase separation and push the ODTs upwards towards higher χN values,13 and (ii) increasing charge fractions will reduce the interfacial tensions/energies between microdomains and finally lower the system free energy due to the reduction in the effective χN values.6 We will further explore the reasons behind this in Year 2 and elaborate on these effects.
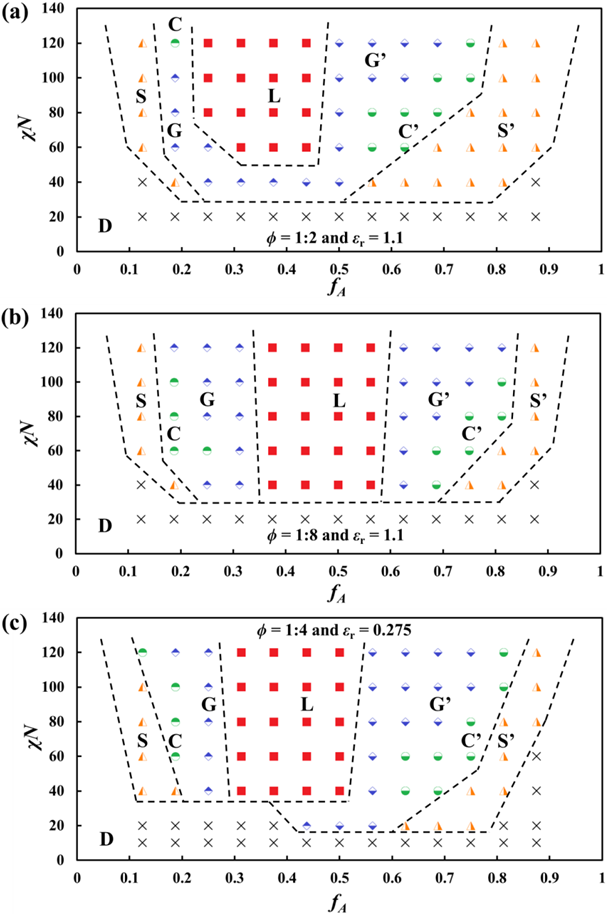
Figure 4: DPD-predicted phase diagrams of charged BCP systems with ϕ = 1:2 (a), 1:8 (b), and 1:4 (c). The corresponding dielectric constant εr = 1.1 for (a) and (b) and 0.275 for (c).
Research Plan for Year 2
Ionic diffusivity for each order phase in a block copolyelectrolyte will be studied in Year 2 to explore practical applications. We will use a diffusivity tensor approach to characterize the contributions to ionic diffusivity from each principal microdomain orientation (see Fig. 5). Then we will quantify the degree of anisotropy in a phase-diagram-like contour plot to inform the optimal phase and experimental conditions for producing an efficient single-ion conductor.
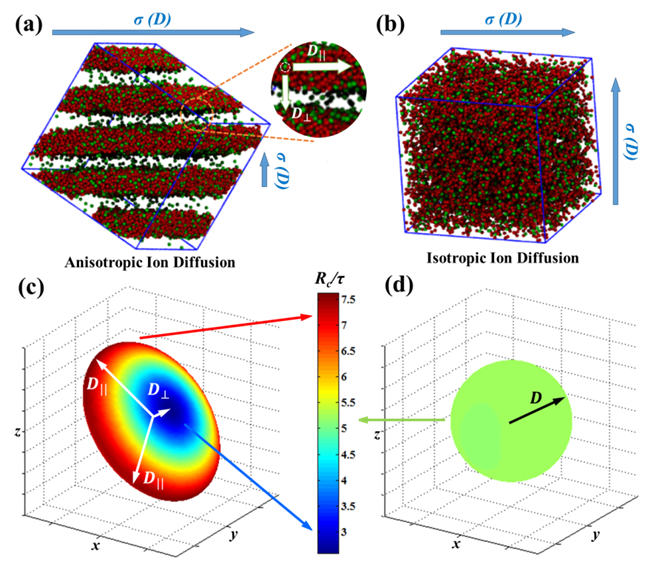
Figure 5: Ionic diffusivity quantified using diffusivity tensors D to reflect the degree of anisotropy in diffusion as a result of microdomain features.