Reports: ND856754-ND8: Travelling at the Speed of Light: Using Luminescence to Quantify Fluvial Sediment Transport
 printer friendly
1. Project Motivation
A better understanding of the relationship between sediment transport rates and climate is needed to model the architecture of sedimentary deposits created by the export of sediment to the oceans. However, it is very difficult to quantify the transport of fine (<250 micron) sediment in rivers over long-term (>1000 year) timescales. This is problematic as this grain size is a productive reservoir for hydrocarbon resources. Our PRF proposal centers on the development of a sediment transport model coupled with luminescence, a property of matter used for geologic dating. We conducted this research because luminescence is a property of matter that is sensitive to sunlight exposure and can be measured in fine sediment. These properties are advantageous because a sunlight-sensitive property should reflect sediment transport dynamics, and because other methods to measure sediment transport are expensive and/or time-consuming.
2. Sediment Transport and Luminescence Modeling
Luminescence has been observed to follow a downstream decrease versus downstream distance. To attempt to explain this downstream decrease in residual luminescence, or zero age luminescence, we introduce a mathematical model, which is similar to those for open channel flow and tracer transport, that describes the space-time evolution of quartz and feldspar luminescence signals in fluvial suspended sand. The model is based on a simple governing equation for the rate of change of grain luminescence, L, with respect to downstream distance, x, as follows:
![]()
Where L is the luminescence of suspended sediment in the channel, x is downstream distance, h (Greek symbol eta) is the amount of sediment exchanged with a storage center per unit distance, 𝑢 is the velocity of sediment in the channel, and 𝜅, 𝛽 are parameters describing removal of luminescence by sunlight. We can measure all other parameters and solve for eta and 𝑢 by fitting these values to field data. The fitted eta and 𝑢 then can be used to calculate the long-term transport of suspended (90-250 micrometer) sediment. We tested this model against previously published datasets, which provided support for the potential of the model [Gray et al., 2017, published in the Journal of Geophysical Research---Earth Surface].
3. Field Testing of the Model
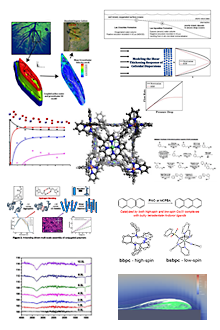
We then tested key predictions of the model in three field sites in the mid-Atlantic region of the United States where sediment transport information is well known. We collected luminescence from the channels of Difficult Run, VA, Linganore Creek, MA, and the South River, VA. We found that our model could successfully produce sediment transport information for the South River. Figure 1 show the results from the South River. We found support for the first prediction of the model, which is that luminescence deceases with downstream distance. Using the best-fitting model runs we calculated sediment transport information, which agrees well with values found from studies using independent measurements (Table 1). This provides supporting evidence for the utility of the model.
Next, we found that complexity introduced by changes in river geomorphology for Difficult Run and Linganore Creek, due to anthropic and natural changes, respectively, were consistent with model predictions but precluded estimation of sediment transport information. In Linganore Creek, a transition from low-relief agricultural river reaches to high-relief forested reaches correlates with an increase in the luminescence in the river channel (Figure 2). This is consistent with the model prediction that a change in the luminescence of sediment delivered to the channel by hillslopes will lead to a change in the luminescence of river sediment as hillslope-derived material is mixed in. In Difficult Run, a long history of strong human modification has added large volumes of sunlight-exposed sediment to the channel and obscured the natural luminescence signal (Figure 3). Overall, our model shows potential. However, the complexity of many river environments can complicate model application.
4. Career Impacts
This research has been impactful on the careers of the investigators. The PI has developed a new research direction in the use of luminescence techniques to quantify soil and sediment transport processes. The graduate student supported by this project (Harrison Gray) developed profession communication skills by presenting these results at the Luminescence and Electron Spin Resonance International Conference and the American Geophysical Union Fall Meeting. He is currently discussing post-doctoral opportunities with the top institutions in the field. These findings also led to an Ann Wintle Prize for Best Presentation (a prize to student research in luminescence science awarded once every three years) and a Geological Society of America Student Science Award (a once a year cash prize awarded to the top ten student projects out of about 700 applicants). Gray was also a runner up for the CSDMS Student Modeler Award (a once a year award to the best student modeler project).
0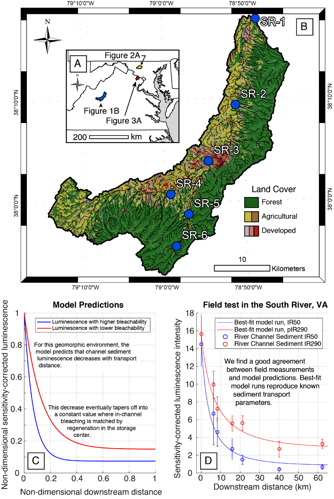
Figure 1. A) Map of the South River catchment showing land cover and drainage network. B) Predictions made by the Gray et al. [2017] model for the geomorphic environment of the South River, VA. C) Comparison of sensitivity-corrected luminescence measurements taken from channel sediment with best-fit model results shown as lines. Circles show the average sensitivity-corrected luminescence intensity taken from large aliquots; bars indicate the standard error.
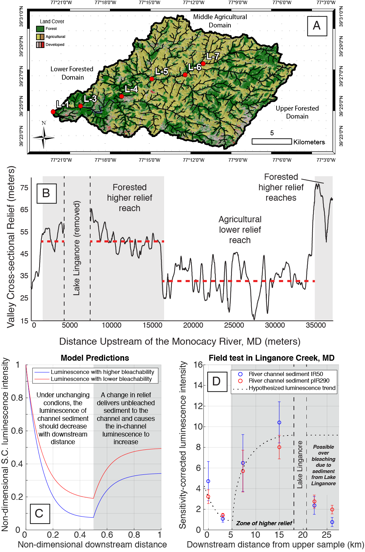
Figure 2. A) Map of the Linganore Creek, MD catchment showing landcover and drainage network. B) Cross sectional valley relief. C) Predictions made by the model (Equation 1) for Linganore Creek, MD. D) Measurements of the in-channel sensitivity-corrected luminescence for Linganore Creek. Gray zone shows area of increased relief interpreted as a new source of unbleached sediment; black dashed line shows our interpretation of the data.
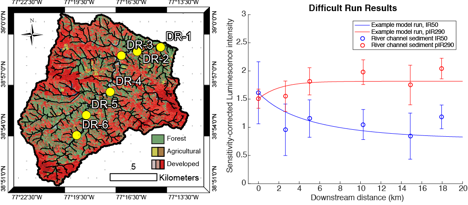
Figure 3. Measurements of luminescence for an urban catchment with a history of human modification. A) Map of Difficult Run, VA, showing land cover, sample locations, and drainage network. Note high concentration of developed land-use. B) Field data. Circles show average sensitivity-corrected luminescence intensity taken from large aliquots; bars indicate standard error. Lines show two example model runs.