Reports: DNI956884-DNI9: Mesoscale Modeling of Stimuli-Responsive Composite Colloids at Oil-Water Interfaces
 printer friendly
The broad goals of the project are (1) to deepen the understanding of interfacial dynamics and self-assembly behavior of pH-responsive polymer-grafted nanoparticles (PGNPs) at the water-oil interface and (2) to provide a theoretical framework that links nanoparticle properties to the possibility of controlling stabilization and destabilization of Pickering emulsions by external triggers. To accomplish these broad goals, we developed a coarse-grained simulation method to model pH-responsive polyelectrolytes, the corresponding PGNPs, and their assembled monolayer at water-oil interfaces. Our model is based on dissipative particle dynamics (DPD) due to its unique capability of efficiently simulating complex fluids and interfacial systems and revealing their dynamics on the mesoscale. Long-range electrostatic interactions are calculated by solving the Poisson equation on a uniform grid with spatially distributed charge. The dielectric discontinuity across biphasic water-oil interface is considered by introducing a local permittivity ratio in the Poisson equation. We have employed a parallel Poisson solver using real-space successive relaxation.
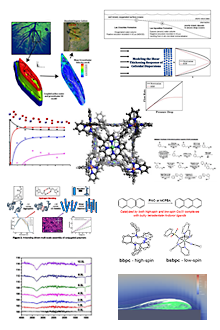
Using electrostatic DPD, we performed several computational sets to discover the adsorption behavior of weak anionic polyelectrolytes (e.g., polyacrylic acid) and polyelectrolyte-grafted nanoparticles. Salt is explicitly incorporated in the system as charged beads, which follows the same Newtonian dynamics as the polymer, particle, and binary solvents. Residence time, defined as the accumulative time during which the polyelectrolyte is adsorbed at the interface, pair correlation function between polymer and oil, and number of adsorbed beads were probed to quantify the interfacial activity of the chain. Figure 1 shows that the adsorption–desorption equilibrium is shifted by the pH-dependent charged state of the polyelectrolytes, where the increase of degree of ionization reduces the interfacial activity of polyelectrolytes and inhibits adsorption. This behavior is attributed to effective electrostatic repulsion applied on polymer induced by the dielectric discontinuity. We have also observed that the addition of monovalent salt can significantly screening electrostatic repulsion and thus promote adsorption.
We further explored the pH-responsive adsorption of polyelectrolyte-grafted nanoparticles. Our results demonstrated that the contact angle of PGNPs can be readily controlled by the degree of ionization of the grafted polymer as shown in Figure 2a. The pair correlation function between the PGNP and oil beads confirms the shift of equilibrium position of PGNP towards the water phase as a result of strong repulsion as the chains become ionized. Therefore, the overall desorption energy of single PGNP quantifying its surface activity decreases with an increase in the degree of ionization (see Figure 2c). Figure 3 displays the associated morphology variation of PGNPs adsorbed at the interface. We observed a transition from a dense disk shape with minimum out-of-plane structure to a homogeneous hemispherical shell upon the ionization of polymer. Similar to the polyelectrolyte, the presence of salt also promotes adsorption of nanoparticle by surrounding the charged chains to screen the electrostatic interactions.
To
probe the effect of particle charge on the monolayer properties, we simulated
adsorbed PGNP monolayers with varying degree of ionization to adjust the
intensity of long-range repulsive interactions. We first characterized the
in-plane structure of monolayer by bond orientational order parameter. The
local bond orientational order parameter of particle j is defined as ![]() , where the sum is taken over Nk
neighboring particles of particle j. It is noteworthy that the ensemble
average of Np total number of particles
, where the sum is taken over Nk
neighboring particles of particle j. It is noteworthy that the ensemble
average of Np total number of particles ![]() indicates that the monolayer has
perfect in-plane hexagonal order. Figure 4 shows that the order parameter
increases monotonically as the degree of ionization increases. The behavior is
consistent for different surface coverages (number of adsorbed particles) and
different chain lengths. Voronoi diagrams in Figure 5 further confirm the
disorder-to-order transition induced by increasing strength of long-range
electrostatic repulsions between particles. Figure 6 plots the structure factor
indicates that the monolayer has
perfect in-plane hexagonal order. Figure 4 shows that the order parameter
increases monotonically as the degree of ionization increases. The behavior is
consistent for different surface coverages (number of adsorbed particles) and
different chain lengths. Voronoi diagrams in Figure 5 further confirm the
disorder-to-order transition induced by increasing strength of long-range
electrostatic repulsions between particles. Figure 6 plots the structure factor
![]() and also demonstrates the structural
transition between disordered liquid phase and crystalline solid phase, where
and also demonstrates the structural
transition between disordered liquid phase and crystalline solid phase, where ![]() is a two-dimensional wave vector and ey
and ez are unit vectors along the y and z
directions in parallel to the monolayer, respectively.
is a two-dimensional wave vector and ey
and ez are unit vectors along the y and z
directions in parallel to the monolayer, respectively.
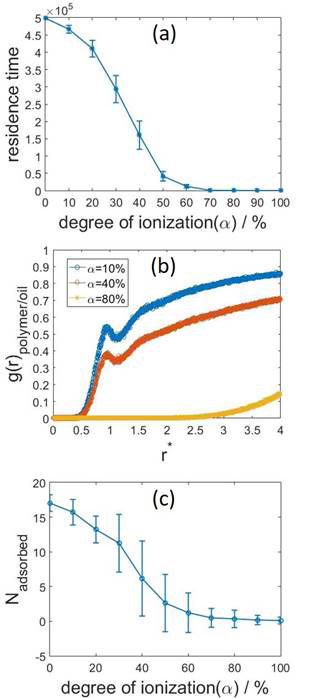
Figure 1. (a) Residence time of linear polyelectrolyte as a function of degree of ionization. (b) Pair correlation functions between the polyelectrolyte and oil bead. The degrees of ionization of polyelectrolytes are 10%, 40% and 80%, which represents three different adsorption states respectively. (c) Time-averaged number of adsorbed beads as a function of degree of ionization. The length of polyelectrolytes in this simulation is 20. The error bars in (a) represent the variations among four independent runs, while the ones in (c) indicate the fluctuation in time in a single simulation.

Figure 2. (a) Contact angle of the polyelectrolyte-grafted nanoparticle as a function of the degree of ionization of grafted polyelectrolytes. (b) Pair correlation functions between the geometric core center of PGNP and oil beads for salt-free systems when the degree of ionization increases from 10% to 50%. The error bars represent the variations among four independent runs.
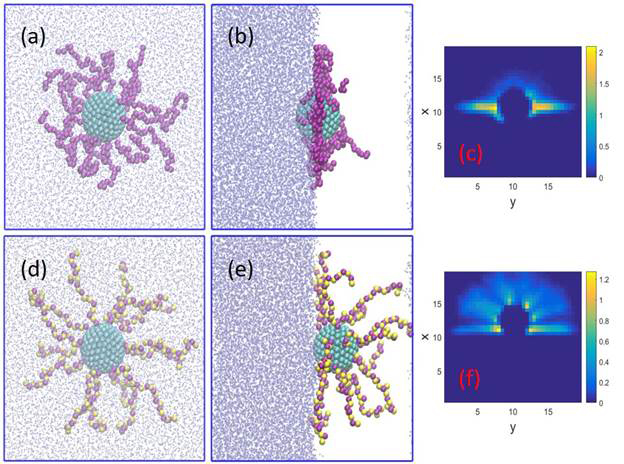
Figure 3. (a) Top view, (b) side view, and (c) time-averaged density contour of polyelectrolyte of the PGNP with a = 0% adsorbed at the water-oil interface. (d) Top view, (e) side view, and (f) time-averaged density contour of polyelectrolyte of the PGNP with a = 50% adsorbed at the water-oil interface. Density contours are sampled in the x-y midplane across the geometric core center of the nanoparticle. The length of polyelectrolytes grafted is 20. The oil beads are plot in points. The beads in yellow color are charged.
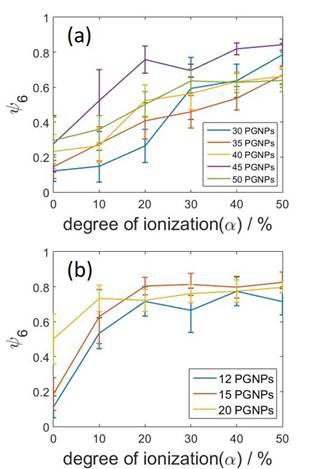
Figure 4. Time-averaged bond orientational order parameter obtained for different numbers of absorbed PGNPs with grafted chains of length (a) 10 and (b) 20 as functions of degree of ionization. The errorbars represent variations among four independent runs.
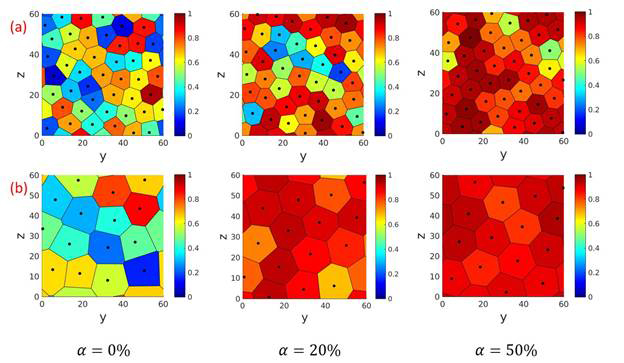
Figure 5. Characeteristic Voronoi diagrams of the PGNP monolayers with grafted chain length (a) 10 and (b) 20 at different degree of ionization. The color of each Voronoic cell represents the magnitude of local bond orientation order parameter.
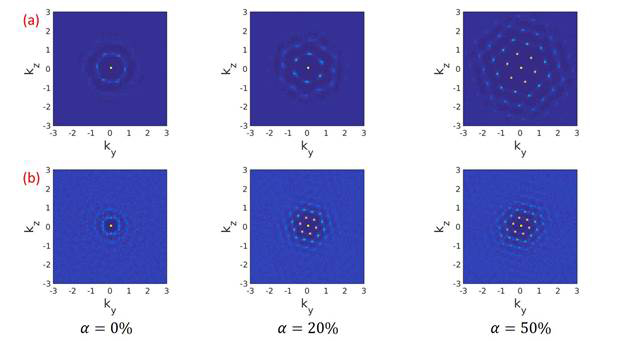
Figure 6. Characteristic density contours of the structure factor S(k) of the PGNP monolayers with grafted chain length (a) 10 and (b) 20 at different degree of ionization.