Reports: DNI255391-DNI2: Rhenium-Osmium Isotope Systematics: Application of Osmium Isotope Stratigraphy and Geochronology in Lacustrine Organic-rich Mudstones
Jeffrey T. Pietras, PhD, Binghamton University
Overview:
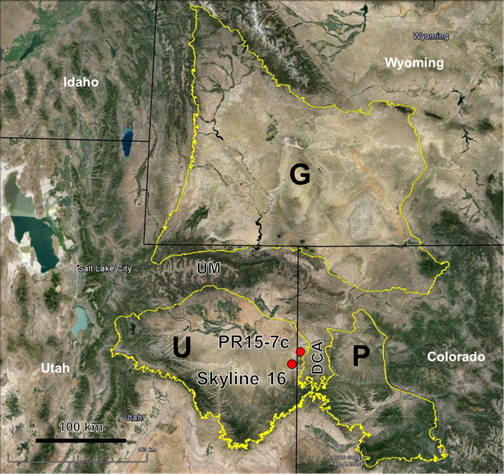
Data analysis has focused on a set of 19 samples collected from the Skyline 16 (12 samples) and the PR15-7c cores (7 samples) located 16 km apart in the eastern Uinta Basin (Figure 1). These samples were collected from the same oil shale bed of the Eocene lacustrine Green River Formation in each core, and help to answer three of the five primary objectives of the proposed research: 1) investigate the control of organic matter type on Re and Os concentrations and Re/Os isotope ratios in lacustrine organic-rich mudstones, 2) determine the initial 187Os/188Os ratio (Osi) from an individual organic-rich mudstone bed separated by more than 10 km to investigate how robust Osi measurements are as chemostratigraphic indicators, and 3) compare Re/Os isochron age determinations of organic-rich mudstones to high precision 40Ar/39Ar age determinations of interbedded volcanic tuffs.
Figure 1. Location of cores studied in this project in the eastern Uinta Basin (U). Outlines of the Greater Green River Basin (G) and Piceance Creek Basin (P) are also shown. Basin outlines modified from Ludington et al., 2005 and Stoeser et al., 2005.
Re and Os Concentrations and Isotopic Abundances:
Rhenium and Os isotopic analysis was conducted in Dr. David Selby’s TOTAL Laboratory for Source Rock Geochronology at Durham University. Results indicate that initial 187Os/188Os ratios (Osi) follow similar trends in both cores (Figure 2). While the variability is low compared to the 2s uncertainties, the similarity of the stratigraphic trends is compelling, indicating that Osi may be a sensitive indicator of changing lake water chemistry.
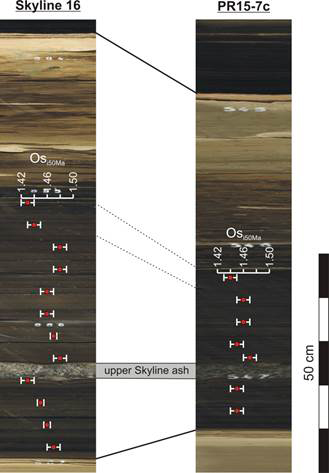
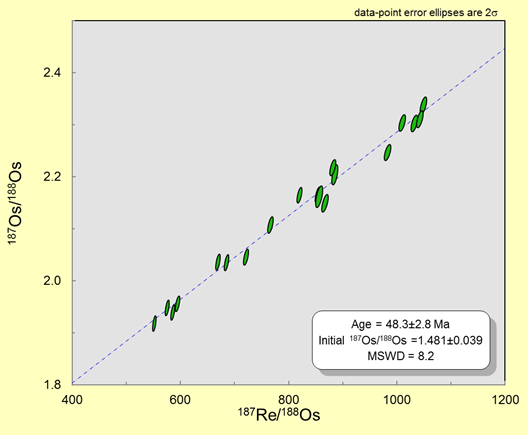
A Model 3 isochron age determination using all 19 samples yields a depositional age of 48.3 ±2.8 Ma for this bed (Figure 3), which is indistinguishable from the 40Ar/39Ar age determination of the Skyline ash located 1-2 m below this bed (Figure 4) of 49.58 ±0.32 Ma (Smith and Carroll, 2015). However, the high MSWD (8.2), and use of a Model 3 age, suggests that there is geologic variability in the Os isotope system. While this limits the resolution of age determinations, it may support the notion that the variability seen in Osi values is geologically significant.
Figure 2. Comparison of Osi values calculated at 50 Ma. 2s uncertainties are shown.
Figure 3. Re-Os isoshron diagram including all 19 samples indicating a Model 3 age of 48.3 ±2.8 Ma.
Figure 4. Correlation of the sampled interval and volcanic tuffs between the cores.
Biomarker Analysis:
Preliminary biomarker analysis was conducted by Dr. Molly Patterson on four samples at the University of Massachusetts Amherst biogeochemistry lab. Based on comparison to similar analysis of organic material from the Green River Formation in the Greater Green River Basin in Wyoming (Figure 1), these samples are most similar to the fluctuating profundal facies association of the Laney Member (Carroll and Bohacs, 2001). This is consistent with sedimentological evidence of repeated lake expansion and contraction (Brembs, 2017). Biomarker analysis indicates the presence of mainly aquatic organic material with a paucity of terrestrial organic matter deposited in a lake with elevated salinity and anoxic bottom waters.
Sample |
pristane/phytane |
b-carotane |
Steranes |
Hopane/Steranes |
SK-1 |
0.14 |
trace/present |
29>28>27 |
0.2 |
SK-6 |
0.19 |
trace/present |
29>28>27 |
0.2 |
SK-12 |
0.27 |
trace/present |
29>28>27 |
0.1 |
PR-4 |
0.16 |
trace/present |
29>28>27 |
0.2 |
Table 1. Preliminary biomarker results.
Rock-Eval/TOC:
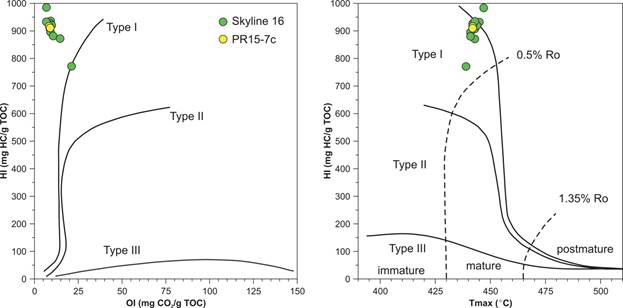
Rock-Eval and LECO TOC measurements were conducted on 12 samples to characterize kerogen type and thermal maturity (Table 2). Analyses were performed by USGS staff at the Geochemistry Laboratory in Lakewood Colorado using standard procedures. Results show that all samples contain immature Type I (lacustrine) kerogen (Figure 5).
Figure 5. HI vs OI and HI vs Tmax cross plots modified from Hunt, 1996.
XRF-based Bulk Rock Elemental Chemistry:
Bulk rock elemental abundance data was collected using a Bruker Tracer III pXRF spectrometer at 1 cm spacing. Preliminary assessment indicates geochemical changes at the same stratigraphic position as changes in Osi values (Figure 6). The implications are currently being investigated; however, these observations provide further support that variations in Osi values are not random.
Figure 6. Re, Os, Osi, and XRF-based elemental data.
Career impact and Graduate Student involvement:
Dr. Patterson is a new faculty member in the Dept. of Geological Sciences and Environmental Studies here at Binghamton University. The biomarker pilot project provided an opportunity for us to collaborate for the first time, and has shown that we have overlapping interests. This has led to other collaborations, which will continue throughout our careers.
My new MS student started in August of 2017. In the short time she has been in my research group she has already gotten herself familiar with the goals of this research project, the geologic setting of the samples, and has worked with me on determining the next set of samples which will be the focus of her research project.
References:
Brembs, R.G., 2017, Cyclostratigraphy and chemostratigraphy in the Parachute Creek Member of the Eocene Green River Formation, Eastern Uinta Basin, Utah [MS Thesis]: Binghamton University, State University of New York, Binghamton, New York, 246 p.
Carroll, A.R., Bohacs, K.M., 2001, Lake-type controls on petroleum source rock potential in nonmarine basins: AAPG Bulletin, v. 85, p. 1033–1053.
Hunt, J.M., 1996, Petroleum Geochemistry and Geology, 2nded: W.H. Freeman and Company, New York.
Ludington, S., Moring, B.C., Miller, R.J., Stone, P.A., Bookstrom, A.A., Bedford, R.T., Evans, J.G., Haxel, G.A., Nutt, C.J., Flyn, K.S., and Hopkins, M.J., 2005, Preliminary integrated geologic map databases for the United States - western states: California, Nevada, Arizona, Washington, Oregon, Idaho, and Utah: USGS OFR 2005-1305.
Stoeser, D.B., Green, G.N., Morath, L.C., Heran, D.W., Wilson, A.B., Moore, D.W., and Van Gosen, B.S, 2005, Preliminary integrated geologic map databases for the United States - Central states: Montana, Wyoming, Colorado, New Mexico, North Dakota, South Dakota, Nebraska, Kansas, Oklahoma, Texas, Iowa, Missouri, Arkansas, and Louisiana: USGS OFRt 2005-1351.
Smith, M.E., and Carroll A.R., 2015, Introduction to the Green River Formation, in Smith, M.E., and Carroll A.R., eds., Stratigraphy and paleolimnology of the Green River Formation, Western USA: Springer, Syntheses in Limnogeology 1, p. 1-12.

