Reports: ND855647-ND8: Grain Size Effects in Sediment Compaction: An Augmented Continuum Theory Based on Grain-Scale Fracture Mechanics
 printer friendly
The activities conducted during the current reporting period involved a combination of experimental and computational tasks.
The experimental tasks focused on testing the hypotheses formulated in the previous year of project. Compression tests on granular solids were conducted at two length scales (individual particles and packed assemblies). To explore the role of size and shape two materials were used: quartz sand and glass beads (Fig. 1).
The results showed that shape and size are critical factors in the energetics of crushing. Particularly, by calibrating a range of contact laws it was shown that in glass beads the mechanism of energy storage prior to fracture is well captured by Hertzian laws, while conical contacts are required for angular grains (Fig. 2). Analysis of the strength of each class of particles also showed major size-dependence. While highly angular sands are successfully modeled by surface fracture laws, a bulk fracture model was found to explain the size-dependence of glass beads (Fig. 3). These evidences were used to interpret measurements obtained for packed systems (Fig. 4). Macroscopic analyses displayed trends similar to those measured at grain scale, thus proving that local effects are preserved also in the continuum. In particular, the grain size-dependence of the energy threshold for macroscopic comminution and the yielding stress were explained through bulk fracture laws (e.g., in case of glass beads) and surface fracture (e.g., in case of angular sands) (Fig. 5). These results simplify dramatically the quantification of the macroscopic properties of granular sediments/rocks, in that they establish a physically-sound link with their basic petrophysical properties.
Further analyses are underway to visualize the patterns of grain crushing during compression by using a compression apparatus allowing compression during X-ray scans. Such analyses are conducted in Ottawa sand (a rounded silica sand) and Q-ROK sand (an angular material). Tomograms have been used to inspect qualitatively and quantitatively the distribution of fractures of specimens compressed above their yielding pressures (Fig. 6). Digital image analysis was employed to process the data and track the evolution of the gradation. Such processing enabled the identification of the prevailing fracture mode by suggesting that rounded particles are more likely to undergo splitting, while angular grains fail through distributed cracking originating at their edges (Fig. 7). Such results provide the first experimental confirmation of findings until now derived only from a theoretical standpoint via fracture mechanics.
From a computational standpoint the continuum law formulated during the previous reporting period was used to explain the role of grain-scale attributes on localized compaction. The model was calibrated against data about the yielding pressure of numerous sandstones (Fig. 8). The model was then combined with the localization theory to quantify the role of grain size and sorting on the likelihood of compaction banding. It was found that changes of the grain size generate a homothetic change of the yielding locus (with the smallest yield surfaces corresponding to a coarser grading) without affecting the type of localized deformation suffered by the rock. By contrast, changes in sorting were found to affect dramatically the type of localization mode. In particular, uniform gradations promote the onset of compaction bands, while polydisperse systems are more susceptible to shear banding (Fig. 9). These findings explain why compaction localization is rare in the Earth’s lithosphere and assist the future identification of deposition mechanisms and tectonic processes which favor its occurrence. These results are discussed in a conference paper and constitute the basis of a systematic numerical analysis of compaction localization currently under development for a journal publication.
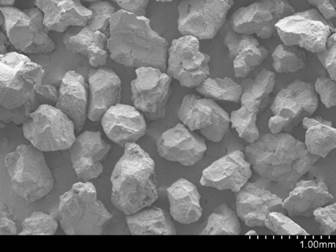

Fig. 1. SEM images of (a) angular sands; (b) rounded large glass beads. Particles of the same class with different size exhibit similar shape characteristics.
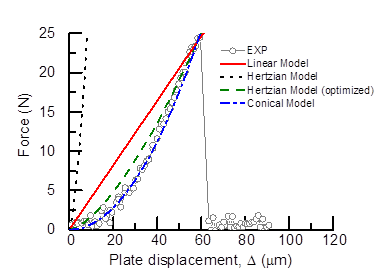

Fig. 2. Examples of crushing tests for individual particles: (a) angular sand (grain size 1.07 mm); (b) glass beads (grain size 1.09 mm). Calibrated parameters specific based on a total number of 90 particles of Q-ROK sand and glass beads.
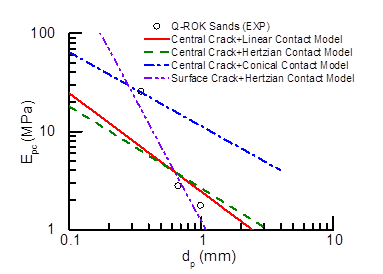
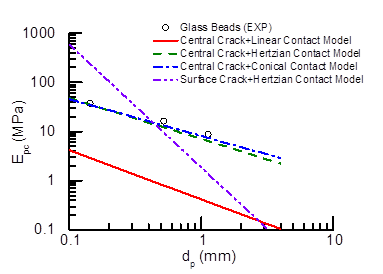
Fig. 3. Grain-scale fracture. Volume-specific energy (Epc) plotted as a function of grain diameter for (a) angular sand particles and (b) glass beads, along with prediction of the four combinations of contact and fracture models.
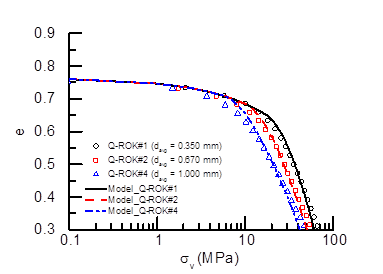
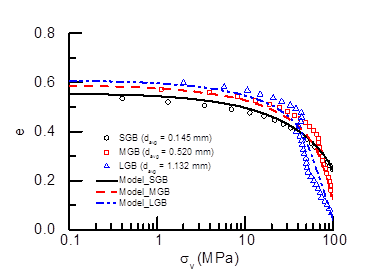
Fig. 4. Oedometric compression tests results and continuum simulations for: (a) angular sands and (b) glass beads.
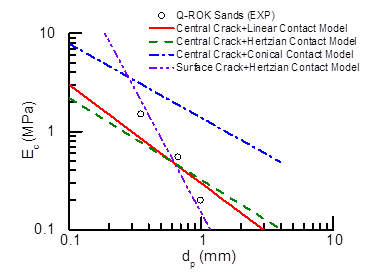
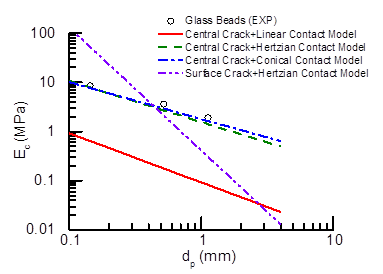
Fig. 5. Breakage energy for a granular continuum displayed as a function of particle diameter for (a) angular sand and (b) glass beads with the performance of four combinations of contact laws and fracture models.
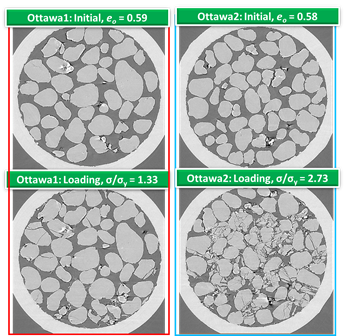
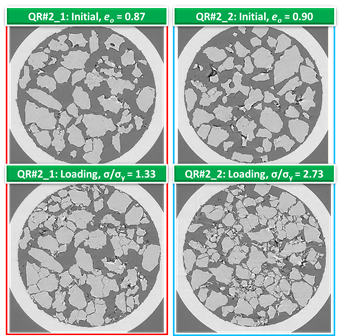
Fig. 6. Tomograms obtained thorugh X-ray scans to study the accumulation of crushing at different stress levels above the yielding pressure (sy). Rounded Ottawa sand (left) and angular Q-ROK sand (right).
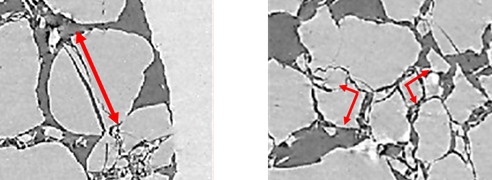
Fig. 7. Inspection of typical particle fracture patterns within a granular specimen subjected to high-pressure compaction. The figure on the left indicates a characteristic mode of fracture in rounded sand, which displays axial splitting with cracks propagating through the grain. The figure on the right displays a characteristic mode of grain fracture in angular sand, which indicates major fracture at the edge and lateral movements of the fragments.
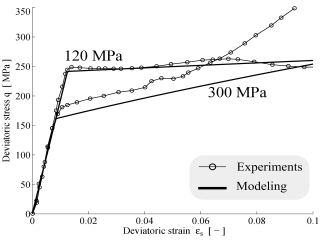
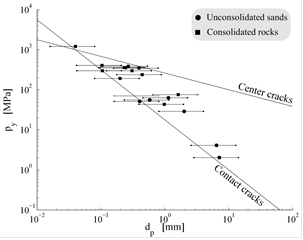
Fig. 8. (a) Deformation of Bentheim sandstone under triaxial compression at two confining pressures and corresponding simulations; (b) Comparison between the isotropic yielding pressure of various sandstones tested in the literature and the scaling laws used in the proposed continuum model.
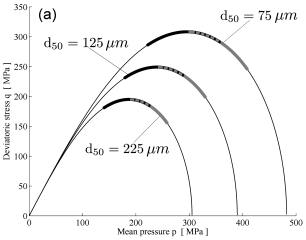
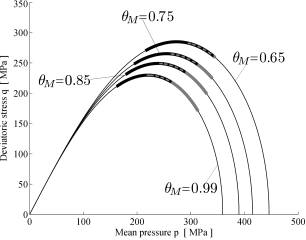
Fig. 9. (a) Variation of yield surface (thin line) and localization domains (thick lines) for different values of mean grain size in monodisperse granular system (example shown for central splitting); (b) Variation of yield surface and strain localization domains for different values of polydispersity (each system has the same mean grain size). The degree of polydispersity is quantified with the index qM, which ranges from 0 (highly polydisperse) to 1 (monodisperse). The predictions show a change in the of localization patterns only for changes in polydispersity (thick black lines indicate shear strain localization, dominant in polydisperse systems, while thick gray lines indicate compaction localization, which appears only in nearly monodisperse rocks).