Reports: DNI554217-DNI5: In Situ Characterization of Small Organic Molecule Oxidation Using Stimulated Raman Spectroscopy
 printer friendly
This project seeks to understand the surface chemistry of a catalyst during the small molecule oxidation reaction. One of the largest hurdles in the catalyst design is the lack of information about the catalyst surface chemistry. Common in situ electronic probes, such as X-ray spectroscopy, do not directly reveal structural information, while structure-telling vibrational probes such as infrared spectroscopy do not efficiently operate in aqueous environments. Raman spectroscopy is one of the few vibrational probes that can operate well in water and can reveal the local structure. However, the signal generated is often inadequate for surface studies.
To overcome this signal limitation, this project harnesses stimulated Raman spectroscopy (SRS), which relies on stimulated emission to increase Raman-scattering efficiency1. SRS is different from conventional surface enhancement methods such as surface-enhanced infrared absorption spectroscopy (SEIRAS) and surface-enhanced Raman spectroscopy (SERS), which rely on the surface evanescent field and therefore may not resolve surface average information due to its extreme sensitivity to the high-electric-field regions (‘hot spot’). Unlike SERS/SEIRAS, SRS can probe the catalyst’s surface uniformly due to its far-field nature, making it an ideal probe.
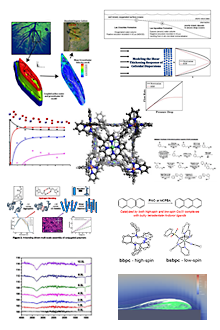
To demonstrate in situ SRS as a new tool for examining the surface of a catalyst during an oxidation reaction, we construct an in situ electrochemical cell integrated with SRS with the support of the ACS PRF. Our design is shown in Figure 1A-B. On the optical side, we use two optical beams to carry out SRS. The pump beam is produced from the optical parametric amplifier (OPA) and is spectrally narrowed. The probe beam is produced from a white-light continuum generation from the sapphire plate. We use the optical Kerr effect to maximize the nonlinear interaction of between the pump and the probe.
Over the past year, we have increased the capability of our SRS analysis to achieve detection of thin films and dilute solutions. Figure 2 (Left) shows the signal to noise ratio of example SRS spectra of monobasic potassium phosphate of different concentrations, collected in our laboratory. We show that our SRS experiment with frequency modulated data analysis (FM-SRS) provides reliable data (SNR > 3) at 62.5mM compared to spontaneous Raman, which struggles starting at 250mM. Figure 2 (Right) show an example FM-SRS spectra of cobalt oxide films deposited in a phosphate buffer (CoPi)2, demonstrating that we are able to obtain signal from 600nm thin films. We note that we have not yet optimized the signal-to-noise ratio for the thin film SRS spectrum. We anticipate better results in the future.
Our next step in the extended period is to integrate the SRS experiment and in situ electrochemical cell that we had developed in the first year of the support period. Notably, we modify the design from the Berkeley and Leiden groups3,4, which used an upward/downward-facing design to sided window (Figure 1B). With the incorporation of SRS-electrochemical cell, we will examine the methanol oxidation reaction and test how the methanol is oxidized (to carbon monoxide, then carbon dioxide.) Finally, an actinic pump will be integrated (Figure 1A) to trigger the reaction, allowing a full experimentation on not only the surface chemistry but also the time evolution of it.
The ACS-PRF support has been transformative for my career and the students who participated in the project. The support enables us to pursue a high-risk, high-reward project that integrates two normally distinct disciplines: ultrafast spectroscopy and electrochemistry. Through this pursuit, we will be able to test the hypothesis of whether advanced spectroscopy can be utilized to reveal surface mechanisms. The impact on the education of the research students is also significant. The ACS PRF has supported two bright Cornell Ph.D. students to learn cutting-edged concepts and skills in ultrafast spectroscopy, surface science, and electrochemistry. The graduate students supported had taken on a mentorship role of a younger undergraduate student who is now pursuing a graduate degree in another institution. Together, they have learned how to work in a collaborative environment and the analytical skills necessary to succeeds in research.
References
1. McCamant, D. W., Kukura, P., Yoon, S. & Mathies, R. a. Femtosecond broadband stimulated Raman spectroscopy: Apparatus and methods. Rev. Sci. Instrum. 75, 4971–80 (2004).
2. Kanan, M. W., Surendranath, Y. & Nocera, D. G. Cobalt-phosphate oxygen-evolving compound. Chem. Soc. Rev. 38, 109–14 (2009).
3. Yeo, B. S. & Bell, A. T. Enhanced activity of gold-supported cobalt oxide for the electrochemical evolution of oxygen. J. Am. Chem. Soc. 133, 5587–93 (2011).
4. Diaz-Morales, O., Calle-Vallejo, F., de Munck, C. & Koper, M. T. M. Electrochemical water splitting by gold: evidence for an oxide decomposition mechanism. Chem. Sci. 4, 2334 (2013).
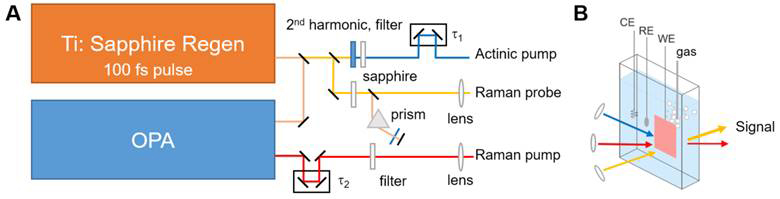
Figure 1. (A) Schematic drawing of the SRS experiment. A Ti:sapphire regenerative amplifier’s fundamental is split into three beams: (i) Raman pump, which is created using the optical parametric amplifier (OPA) to shift to the 633 nm wavelength (in order to keep ~3,000 cm–1 within the Si detector bandwidth) and then spectrally narrowed, (ii) Raman probe, which is created from a continuum generation, and (iii) actinic pump, which is created via the 2nd harmonic generation in a barium borate crystal. (B) Schematic drawing of the in situ electrochemical cell. All three beams are incident on the surface during the methanol oxidation reaction. CE: Counter electrode; RE: Reference electrode, WE: Working electrode.

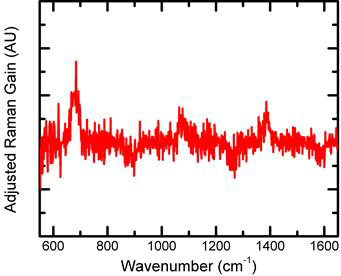
Figure 2. (Left) SNR analysis of monobasic potassium phosphate of different concentrations using different Raman techniques. SNR was calculated as peak height of the 1000 cm-1 peak over the rms of the flat background region (around 1200 cm-1). Crossed-out data points indicate spectra where raman peaks are not visible. (Right) Our preliminary frequency-modulates stimulated Raman spectra of a CoPi thin film (~650nm thick). The 685cm-1 peak resembles the cobalt oxide peaks reported by Bell and the 1065cm-1 peak is attributed to peaks from the phosphates. 1400cm-1 peak has not been identified yet.